
 Yahoo Finance
 Introducing Watkin Jones (LON:WJG), A Stock That Climbed 94% In The Last Three Years

By buying an index fund, investors can approximate the average market return. But many of us dare to dream of bigger returns, and build a portfolio ourselves. For example, Watkin Jones Plc (LON:WJG) shareholders have seen the share price rise 94% over three years, well in excess of the market return (3.2%, not including dividends). On the other hand, the returns haven't been quite so good recently, with shareholders up just 13%, including dividends.
See our latest analysis for Watkin Jones
There is no denying that markets are sometimes efficient, but prices do not always reflect underlying business performance. One flawed but reasonable way to assess how sentiment around a company has changed is to compare the earnings per share (EPS) with the share price.
During the three years of share price growth, Watkin Jones actually saw its earnings per share (EPS) drop 28% per year. So we doubt that the market is looking to EPS for its main judge of the company's value. Therefore, we think it's worth considering other metrics as well.
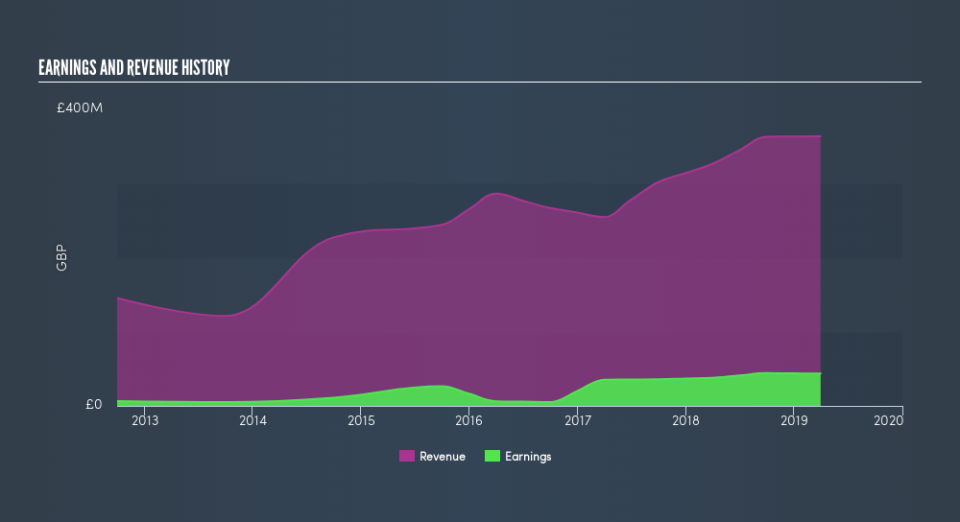
It may well be that Watkin Jones revenue growth rate of 12% over three years has convinced shareholders to believe in a brighter future. In that case, the company may be sacrificing current earnings per share to drive growth, and maybe shareholder's faith in better days ahead will be rewarded.
The image below shows how earnings and revenue have tracked over time (if you click on the image you can see greater detail).
We know that Watkin Jones has improved its bottom line lately, but what does the future have in store? If you are thinking of buying or selling Watkin Jones stock, you should check out this free report showing analyst profit forecasts.
What About Dividends?
When looking at investment returns, it is important to consider the difference between total shareholder return (TSR) and share price return. The TSR is a return calculation that accounts for the value of cash dividends (assuming that any dividend received was reinvested) and the calculated value of any discounted capital raisings and spin-offs. It's fair to say that the TSR gives a more complete picture for stocks that pay a dividend. We note that for Watkin Jones the TSR over the last 3 years was 115%, which is better than the share price return mentioned above. This is largely a result of its dividend payments!
A Different Perspective
It's nice to see that Watkin Jones shareholders have gained 13% (in total) over the last year. That includes the value of the dividend. But the three year TSR of 29% per year is even better. Before spending more time on Watkin Jones it might be wise to click here to see if insiders have been buying or selling shares.
If you would prefer to check out another company -- one with potentially superior financials -- then do not miss this free list of companies that have proven they can grow earnings.
Please note, the market returns quoted in this article reflect the market weighted average returns of stocks that currently trade on GB exchanges.
We aim to bring you long-term focused research analysis driven by fundamental data. Note that our analysis may not factor in the latest price-sensitive company announcements or qualitative material.
If you spot an error that warrants correction, please contact the editor at editorial-team@simplywallst.com. This article by Simply Wall St is general in nature. It does not constitute a recommendation to buy or sell any stock, and does not take account of your objectives, or your financial situation. Simply Wall St has no position in the stocks mentioned. Thank you for reading.
