
 Yahoo Finance
 Introducing XpresSpa Group (NASDAQ:XSPA), The Stock That Collapsed 99%

XpresSpa Group, Inc. (NASDAQ:XSPA) has rebounded strongly over the last week, with the share price soaring 49%. But that doesn't change the fact that the returns over the last half decade have been stomach churning. In fact, the share price has tumbled down a mountain to land 99% lower after that period. It's true that the recent bounce could signal the company is turning over a new leaf, but we are not so sure. The fundamental business performance will ultimately determine if the turnaround can be sustained.
While a drop like that is definitely a body blow, money isn't as important as health and happiness.
See our latest analysis for XpresSpa Group
XpresSpa Group isn't currently profitable, so most analysts would look to revenue growth to get an idea of how fast the underlying business is growing. When a company doesn't make profits, we'd generally expect to see good revenue growth. That's because it's hard to be confident a company will be sustainable if revenue growth is negligible, and it never makes a profit.
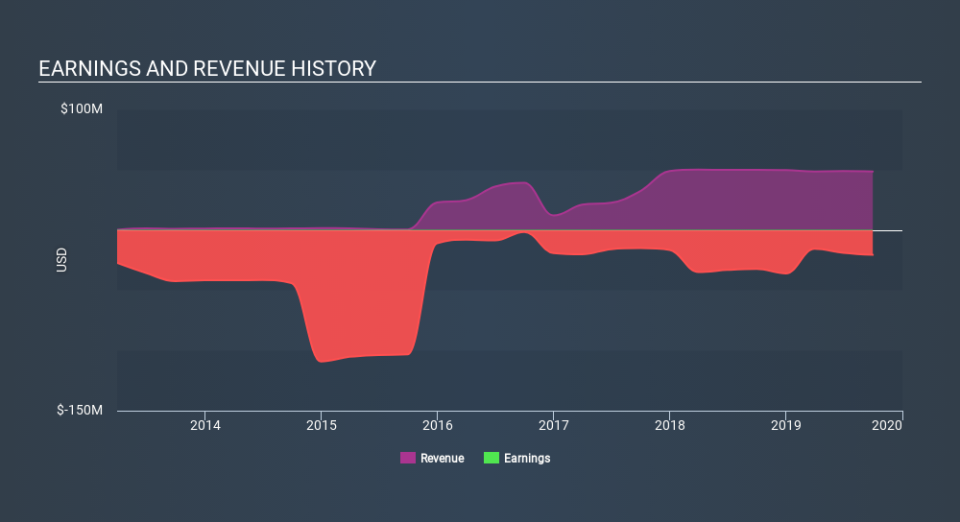
In the last half decade, XpresSpa Group saw its revenue increase by 39% per year. That's well above most other pre-profit companies. So it's not at all clear to us why the share price sunk 62% throughout that time. It could be that the stock was over-hyped before. We'd recommend carefully checking for indications of future growth - and balance sheet threats - before considering a purchase.
The graphic below depicts how earnings and revenue have changed over time (unveil the exact values by clicking on the image).
This free interactive report on XpresSpa Group's balance sheet strength is a great place to start, if you want to investigate the stock further.
A Different Perspective
XpresSpa Group shareholders are down 78% for the year, but the market itself is up 28%. Even the share prices of good stocks drop sometimes, but we want to see improvements in the fundamental metrics of a business, before getting too interested. Regrettably, last year's performance caps off a bad run, with the shareholders facing a total loss of 62% per year over five years. Generally speaking long term share price weakness can be a bad sign, though contrarian investors might want to research the stock in hope of a turnaround. I find it very interesting to look at share price over the long term as a proxy for business performance. But to truly gain insight, we need to consider other information, too. Consider for instance, the ever-present spectre of investment risk. We've identified 5 warning signs with XpresSpa Group (at least 2 which shouldn't be ignored) , and understanding them should be part of your investment process.
We will like XpresSpa Group better if we see some big insider buys. While we wait, check out this free list of growing companies with considerable, recent, insider buying.
Please note, the market returns quoted in this article reflect the market weighted average returns of stocks that currently trade on US exchanges.
If you spot an error that warrants correction, please contact the editor at editorial-team@simplywallst.com. This article by Simply Wall St is general in nature. It does not constitute a recommendation to buy or sell any stock, and does not take account of your objectives, or your financial situation. Simply Wall St has no position in the stocks mentioned.
We aim to bring you long-term focused research analysis driven by fundamental data. Note that our analysis may not factor in the latest price-sensitive company announcements or qualitative material. Thank you for reading.
