
 Yahoo Finance
 Investing in Cepatwawasan Group Berhad (KLSE:CEPAT) three years ago would have delivered you a 36% gain
One simple way to benefit from the stock market is to buy an index fund. But if you buy good businesses at attractive prices, your portfolio returns could exceed the average market return. For example, the Cepatwawasan Group Berhad (KLSE:CEPAT) share price is up 22% in the last three years, clearly besting the market decline of around 1.2% (not including dividends). However, more recent returns haven't been as impressive as that, with the stock returning just 1.3% in the last year , including dividends .
Let's take a look at the underlying fundamentals over the longer term, and see if they've been consistent with shareholders returns.
See our latest analysis for Cepatwawasan Group Berhad
In his essay The Superinvestors of Graham-and-Doddsville Warren Buffett described how share prices do not always rationally reflect the value of a business. One imperfect but simple way to consider how the market perception of a company has shifted is to compare the change in the earnings per share (EPS) with the share price movement.
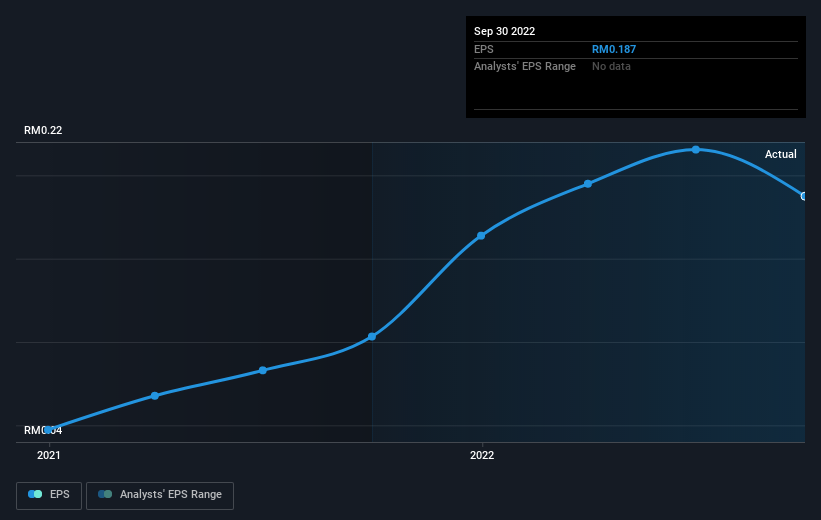
Cepatwawasan Group Berhad became profitable within the last three years. So we would expect a higher share price over the period.
The graphic below depicts how EPS has changed over time (unveil the exact values by clicking on the image).
Dive deeper into Cepatwawasan Group Berhad's key metrics by checking this interactive graph of Cepatwawasan Group Berhad's earnings, revenue and cash flow.
What About Dividends?
When looking at investment returns, it is important to consider the difference between total shareholder return (TSR) and share price return. The TSR is a return calculation that accounts for the value of cash dividends (assuming that any dividend received was reinvested) and the calculated value of any discounted capital raisings and spin-offs. It's fair to say that the TSR gives a more complete picture for stocks that pay a dividend. We note that for Cepatwawasan Group Berhad the TSR over the last 3 years was 36%, which is better than the share price return mentioned above. This is largely a result of its dividend payments!
A Different Perspective
Cepatwawasan Group Berhad shareholders are up 1.3% for the year (even including dividends). But that return falls short of the market. On the bright side, that's still a gain, and it is certainly better than the yearly loss of about 0.2% endured over half a decade. So this might be a sign the business has turned its fortunes around. I find it very interesting to look at share price over the long term as a proxy for business performance. But to truly gain insight, we need to consider other information, too. Case in point: We've spotted 1 warning sign for Cepatwawasan Group Berhad you should be aware of.
For those who like to find winning investments this free list of growing companies with recent insider purchasing, could be just the ticket.
Please note, the market returns quoted in this article reflect the market weighted average returns of stocks that currently trade on MY exchanges.
Have feedback on this article? Concerned about the content? Get in touch with us directly. Alternatively, email editorial-team (at) simplywallst.com.
This article by Simply Wall St is general in nature. We provide commentary based on historical data and analyst forecasts only using an unbiased methodology and our articles are not intended to be financial advice. It does not constitute a recommendation to buy or sell any stock, and does not take account of your objectives, or your financial situation. We aim to bring you long-term focused analysis driven by fundamental data. Note that our analysis may not factor in the latest price-sensitive company announcements or qualitative material. Simply Wall St has no position in any stocks mentioned.
Join A Paid User Research Session
You’ll receive a US$30 Amazon Gift card for 1 hour of your time while helping us build better investing tools for the individual investors like yourself. Sign up here
