
 Yahoo Finance
 Investing in Occidental Petroleum (NYSE:OXY) three years ago would have delivered you a 321% gain
Generally speaking, investors are inspired to be stock pickers by the potential to find the big winners. You won't get it right every time, but when you do, the returns can be truly splendid. For example, the Occidental Petroleum Corporation (NYSE:OXY) share price is up a whopping 314% in the last three years, a handsome return for long term holders. Meanwhile the share price is 1.3% higher than it was a week ago.
So let's assess the underlying fundamentals over the last 3 years and see if they've moved in lock-step with shareholder returns.
See our latest analysis for Occidental Petroleum
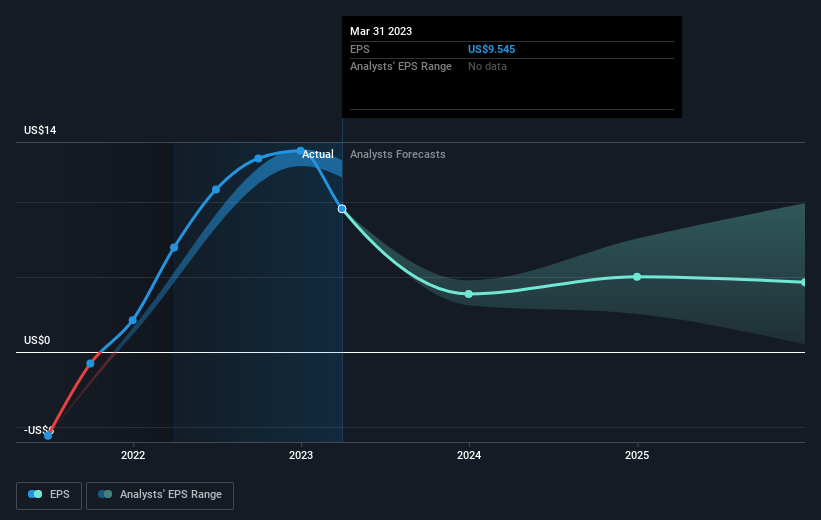
While markets are a powerful pricing mechanism, share prices reflect investor sentiment, not just underlying business performance. One way to examine how market sentiment has changed over time is to look at the interaction between a company's share price and its earnings per share (EPS).
Occidental Petroleum became profitable within the last three years. That kind of transition can be an inflection point that justifies a strong share price gain, just as we have seen here.
The company's earnings per share (over time) is depicted in the image below (click to see the exact numbers).
We know that Occidental Petroleum has improved its bottom line over the last three years, but what does the future have in store? You can see how its balance sheet has strengthened (or weakened) over time in this free interactive graphic.
What About Dividends?
It is important to consider the total shareholder return, as well as the share price return, for any given stock. Whereas the share price return only reflects the change in the share price, the TSR includes the value of dividends (assuming they were reinvested) and the benefit of any discounted capital raising or spin-off. Arguably, the TSR gives a more comprehensive picture of the return generated by a stock. As it happens, Occidental Petroleum's TSR for the last 3 years was 321%, which exceeds the share price return mentioned earlier. This is largely a result of its dividend payments!
A Different Perspective
Investors in Occidental Petroleum had a tough year, with a total loss of 2.3% (including dividends), against a market gain of about 12%. Even the share prices of good stocks drop sometimes, but we want to see improvements in the fundamental metrics of a business, before getting too interested. However, the loss over the last year isn't as bad as the 2% per annum loss investors have suffered over the last half decade. We would want clear information suggesting the company will grow, before taking the view that the share price will stabilize. I find it very interesting to look at share price over the long term as a proxy for business performance. But to truly gain insight, we need to consider other information, too. Case in point: We've spotted 2 warning signs for Occidental Petroleum you should be aware of, and 1 of them is potentially serious.
Of course, you might find a fantastic investment by looking elsewhere. So take a peek at this free list of companies we expect will grow earnings.
Please note, the market returns quoted in this article reflect the market weighted average returns of stocks that currently trade on American exchanges.
Have feedback on this article? Concerned about the content? Get in touch with us directly. Alternatively, email editorial-team (at) simplywallst.com.
This article by Simply Wall St is general in nature. We provide commentary based on historical data and analyst forecasts only using an unbiased methodology and our articles are not intended to be financial advice. It does not constitute a recommendation to buy or sell any stock, and does not take account of your objectives, or your financial situation. We aim to bring you long-term focused analysis driven by fundamental data. Note that our analysis may not factor in the latest price-sensitive company announcements or qualitative material. Simply Wall St has no position in any stocks mentioned.
