
 Yahoo Finance
 Investing in Provident Financial Holdings (NASDAQ:PROV) five years ago would have delivered you a 1.9% gain
While it may not be enough for some shareholders, we think it is good to see the Provident Financial Holdings, Inc. (NASDAQ:PROV) share price up 26% in a single quarter. But if you look at the last five years the returns have not been good. After all, the share price is down 15% in that time, significantly under-performing the market.
Now let's have a look at the company's fundamentals, and see if the long term shareholder return has matched the performance of the underlying business.
View our latest analysis for Provident Financial Holdings
While the efficient markets hypothesis continues to be taught by some, it has been proven that markets are over-reactive dynamic systems, and investors are not always rational. By comparing earnings per share (EPS) and share price changes over time, we can get a feel for how investor attitudes to a company have morphed over time.
While the share price declined over five years, Provident Financial Holdings actually managed to increase EPS by an average of 16% per year. Given the share price reaction, one might suspect that EPS is not a good guide to the business performance during the period (perhaps due to a one-off loss or gain). Or possibly, the market was previously very optimistic, so the stock has disappointed, despite improving EPS.
It is unusual to see such modest share price growth in the face of sustained EPS improvements. We can look to other metrics to try to understand the situation better.
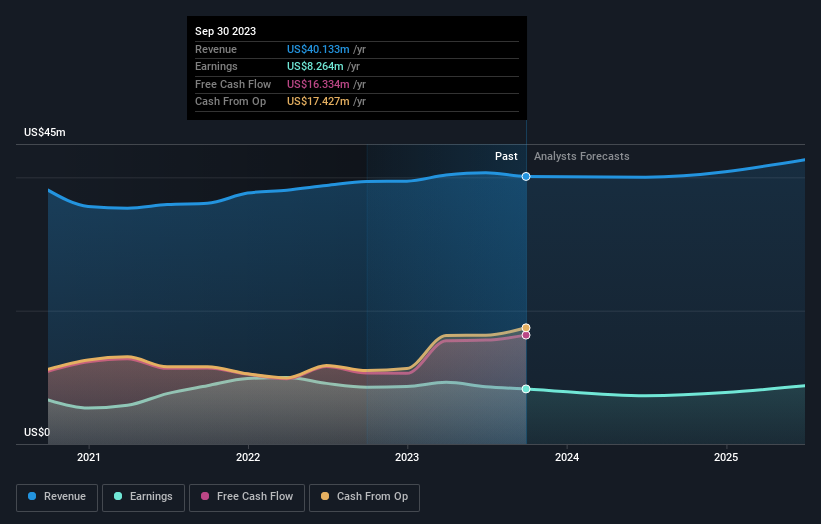
Arguably, the revenue drop of 7.6% a year for half a decade suggests that the company can't grow in the long term. This has probably encouraged some shareholders to sell down the stock.
You can see how earnings and revenue have changed over time in the image below (click on the chart to see the exact values).
If you are thinking of buying or selling Provident Financial Holdings stock, you should check out this FREE detailed report on its balance sheet.
What About Dividends?
When looking at investment returns, it is important to consider the difference between total shareholder return (TSR) and share price return. The TSR is a return calculation that accounts for the value of cash dividends (assuming that any dividend received was reinvested) and the calculated value of any discounted capital raisings and spin-offs. Arguably, the TSR gives a more comprehensive picture of the return generated by a stock. We note that for Provident Financial Holdings the TSR over the last 5 years was 1.9%, which is better than the share price return mentioned above. And there's no prize for guessing that the dividend payments largely explain the divergence!
A Different Perspective
Provident Financial Holdings shareholders gained a total return of 9.1% during the year. Unfortunately this falls short of the market return. The silver lining is that the gain was actually better than the average annual return of 0.4% per year over five year. It is possible that returns will improve along with the business fundamentals. Keeping this in mind, a solid next step might be to take a look at Provident Financial Holdings' dividend track record. This free interactive graph is a great place to start.
Of course Provident Financial Holdings may not be the best stock to buy. So you may wish to see this free collection of growth stocks.
Please note, the market returns quoted in this article reflect the market weighted average returns of stocks that currently trade on American exchanges.
Have feedback on this article? Concerned about the content? Get in touch with us directly. Alternatively, email editorial-team (at) simplywallst.com.
This article by Simply Wall St is general in nature. We provide commentary based on historical data and analyst forecasts only using an unbiased methodology and our articles are not intended to be financial advice. It does not constitute a recommendation to buy or sell any stock, and does not take account of your objectives, or your financial situation. We aim to bring you long-term focused analysis driven by fundamental data. Note that our analysis may not factor in the latest price-sensitive company announcements or qualitative material. Simply Wall St has no position in any stocks mentioned.
