
 Yahoo Finance
 Investor Optimism Abounds Accordant Group Limited (NZSE:AGL) But Growth Is Lacking
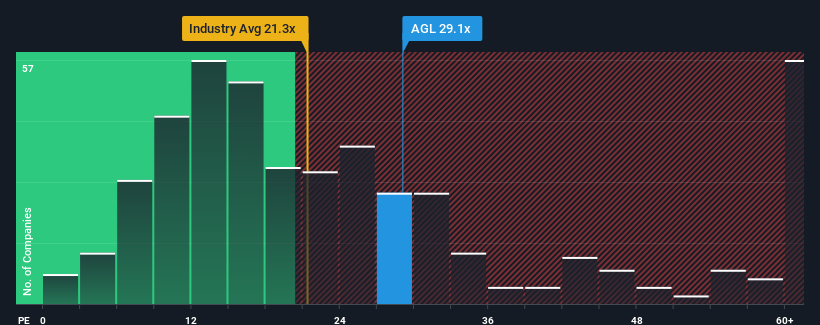
Accordant Group Limited's (NZSE:AGL) price-to-earnings (or "P/E") ratio of 29.1x might make it look like a strong sell right now compared to the market in New Zealand, where around half of the companies have P/E ratios below 15x and even P/E's below 10x are quite common. Although, it's not wise to just take the P/E at face value as there may be an explanation why it's so lofty.
For example, consider that Accordant Group's financial performance has been poor lately as its earnings have been in decline. One possibility is that the P/E is high because investors think the company will still do enough to outperform the broader market in the near future. You'd really hope so, otherwise you're paying a pretty hefty price for no particular reason.
See our latest analysis for Accordant Group
Want the full picture on earnings, revenue and cash flow for the company? Then our free report on Accordant Group will help you shine a light on its historical performance.
How Is Accordant Group's Growth Trending?
The only time you'd be truly comfortable seeing a P/E as steep as Accordant Group's is when the company's growth is on track to outshine the market decidedly.
Taking a look back first, the company's earnings per share growth last year wasn't something to get excited about as it posted a disappointing decline of 71%. As a result, earnings from three years ago have also fallen 79% overall. Accordingly, shareholders would have felt downbeat about the medium-term rates of earnings growth.
Comparing that to the market, which is predicted to deliver 8.8% growth in the next 12 months, the company's downward momentum based on recent medium-term earnings results is a sobering picture.
With this information, we find it concerning that Accordant Group is trading at a P/E higher than the market. Apparently many investors in the company are way more bullish than recent times would indicate and aren't willing to let go of their stock at any price. There's a very good chance existing shareholders are setting themselves up for future disappointment if the P/E falls to levels more in line with the recent negative growth rates.
The Final Word
Using the price-to-earnings ratio alone to determine if you should sell your stock isn't sensible, however it can be a practical guide to the company's future prospects.
Our examination of Accordant Group revealed its shrinking earnings over the medium-term aren't impacting its high P/E anywhere near as much as we would have predicted, given the market is set to grow. When we see earnings heading backwards and underperforming the market forecasts, we suspect the share price is at risk of declining, sending the high P/E lower. Unless the recent medium-term conditions improve markedly, it's very challenging to accept these prices as being reasonable.
We don't want to rain on the parade too much, but we did also find 7 warning signs for Accordant Group (3 shouldn't be ignored!) that you need to be mindful of.
If P/E ratios interest you, you may wish to see this free collection of other companies with strong earnings growth and low P/E ratios.
Have feedback on this article? Concerned about the content? Get in touch with us directly. Alternatively, email editorial-team (at) simplywallst.com.
This article by Simply Wall St is general in nature. We provide commentary based on historical data and analyst forecasts only using an unbiased methodology and our articles are not intended to be financial advice. It does not constitute a recommendation to buy or sell any stock, and does not take account of your objectives, or your financial situation. We aim to bring you long-term focused analysis driven by fundamental data. Note that our analysis may not factor in the latest price-sensitive company announcements or qualitative material. Simply Wall St has no position in any stocks mentioned.
