
 Yahoo Finance
 Investor Optimism Abounds IRESS Limited (ASX:IRE) But Growth Is Lacking

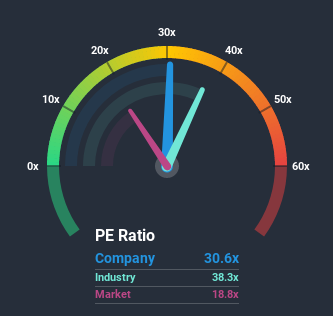
With a price-to-earnings (or "P/E") ratio of 30.6x IRESS Limited (ASX:IRE) may be sending very bearish signals at the moment, given that almost half of all companies in Australia have P/E ratios under 18x and even P/E's lower than 10x are not unusual. Although, it's not wise to just take the P/E at face value as there may be an explanation why it's so lofty.
With only a limited decrease in earnings compared to most other companies of late, IRESS has been doing relatively well. The P/E is probably high because investors think this comparatively better earnings performance will continue. If not, then existing shareholders might be a little nervous about the viability of the share price, especially if earnings continue to dissolve.
View our latest analysis for IRESS
If you'd like to see what analysts are forecasting going forward, you should check out our free report on IRESS.
Does Growth Match The High P/E?
There's an inherent assumption that a company should far outperform the market for P/E ratios like IRESS' to be considered reasonable.
Taking a look back first, the company's earnings per share growth last year wasn't something to get excited about as it posted a disappointing decline of 3.5%. At least EPS has managed not to go completely backwards from three years ago in aggregate, thanks to the earlier period of growth. Accordingly, shareholders probably wouldn't have been overly satisfied with the unstable medium-term growth rates.
Turning to the outlook, the next three years should generate growth of 4.8% per annum as estimated by the six analysts watching the company. That's shaping up to be materially lower than the 18% each year growth forecast for the broader market.
With this information, we find it concerning that IRESS is trading at a P/E higher than the market. It seems most investors are hoping for a turnaround in the company's business prospects, but the analyst cohort is not so confident this will happen. There's a good chance these shareholders are setting themselves up for future disappointment if the P/E falls to levels more in line with the growth outlook.
The Key Takeaway
Generally, our preference is to limit the use of the price-to-earnings ratio to establishing what the market thinks about the overall health of a company.
We've established that IRESS currently trades on a much higher than expected P/E since its forecast growth is lower than the wider market. When we see a weak earnings outlook with slower than market growth, we suspect the share price is at risk of declining, sending the high P/E lower. Unless these conditions improve markedly, it's very challenging to accept these prices as being reasonable.
Don't forget that there may be other risks. For instance, we've identified 2 warning signs for IRESS (1 is significant) you should be aware of.
If these risks are making you reconsider your opinion on IRESS, explore our interactive list of high quality stocks to get an idea of what else is out there.
This article by Simply Wall St is general in nature. It does not constitute a recommendation to buy or sell any stock, and does not take account of your objectives, or your financial situation. We aim to bring you long-term focused analysis driven by fundamental data. Note that our analysis may not factor in the latest price-sensitive company announcements or qualitative material. Simply Wall St has no position in any stocks mentioned.
Have feedback on this article? Concerned about the content? Get in touch with us directly. Alternatively, email editorial-team@simplywallst.com.
