
 Yahoo Finance
 Investors Appear Satisfied With The TJX Companies, Inc.'s (NYSE:TJX) Prospects
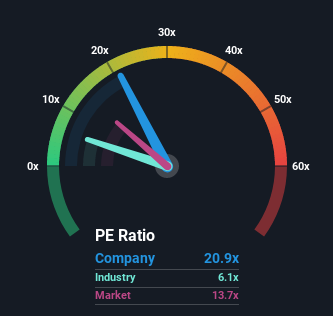
When close to half the companies in the United States have price-to-earnings ratios (or "P/E's") below 13x, you may consider The TJX Companies, Inc. (NYSE:TJX) as a stock to avoid entirely with its 20.9x P/E ratio. Although, it's not wise to just take the P/E at face value as there may be an explanation why it's so lofty.
TJX Companies certainly has been doing a good job lately as it's been growing earnings more than most other companies. It seems that many are expecting the strong earnings performance to persist, which has raised the P/E. If not, then existing shareholders might be a little nervous about the viability of the share price.
View our latest analysis for TJX Companies
Keen to find out how analysts think TJX Companies' future stacks up against the industry? In that case, our free report is a great place to start.
Is There Enough Growth For TJX Companies?
In order to justify its P/E ratio, TJX Companies would need to produce outstanding growth well in excess of the market.
Retrospectively, the last year delivered an exceptional 37% gain to the company's bottom line. The latest three year period has also seen a 15% overall rise in EPS, aided extensively by its short-term performance. Accordingly, shareholders would have probably been satisfied with the medium-term rates of earnings growth.
Turning to the outlook, the next three years should generate growth of 13% each year as estimated by the analysts watching the company. That's shaping up to be materially higher than the 9.6% per year growth forecast for the broader market.
With this information, we can see why TJX Companies is trading at such a high P/E compared to the market. It seems most investors are expecting this strong future growth and are willing to pay more for the stock.
The Key Takeaway
Generally, our preference is to limit the use of the price-to-earnings ratio to establishing what the market thinks about the overall health of a company.
As we suspected, our examination of TJX Companies' analyst forecasts revealed that its superior earnings outlook is contributing to its high P/E. Right now shareholders are comfortable with the P/E as they are quite confident future earnings aren't under threat. It's hard to see the share price falling strongly in the near future under these circumstances.
It's always necessary to consider the ever-present spectre of investment risk. We've identified 3 warning signs with TJX Companies (at least 1 which is potentially serious), and understanding these should be part of your investment process.
It's important to make sure you look for a great company, not just the first idea you come across. So take a peek at this free list of interesting companies with strong recent earnings growth (and a P/E ratio below 20x).
Have feedback on this article? Concerned about the content? Get in touch with us directly. Alternatively, email editorial-team (at) simplywallst.com.
This article by Simply Wall St is general in nature. We provide commentary based on historical data and analyst forecasts only using an unbiased methodology and our articles are not intended to be financial advice. It does not constitute a recommendation to buy or sell any stock, and does not take account of your objectives, or your financial situation. We aim to bring you long-term focused analysis driven by fundamental data. Note that our analysis may not factor in the latest price-sensitive company announcements or qualitative material. Simply Wall St has no position in any stocks mentioned.
Join A Paid User Research Session
You’ll receive a US$30 Amazon Gift card for 1 hour of your time while helping us build better investing tools for the individual investors like yourself. Sign up here
