
 Yahoo Finance
 Investors in Conformis (NASDAQ:CFMS) from five years ago are still down 89%, even after 32% gain this past week
Conformis, Inc. (NASDAQ:CFMS) shareholders are doubtless heartened to see the share price bounce 32% in just one week. But will that repair the damage for the weary investors who have owned this stock as it declined over half a decade? Probably not. Five years have seen the share price descend precipitously, down a full 89%. So we don't gain too much confidence from the recent recovery. The fundamental business performance will ultimately determine if the turnaround can be sustained. While a drop like that is definitely a body blow, money isn't as important as health and happiness.
The recent uptick of 32% could be a positive sign of things to come, so let's take a lot at historical fundamentals.
See our latest analysis for Conformis
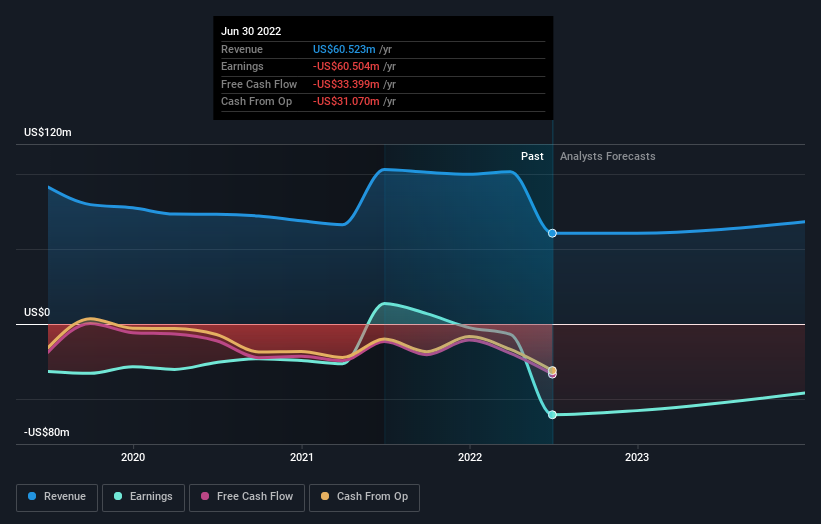
Conformis isn't currently profitable, so most analysts would look to revenue growth to get an idea of how fast the underlying business is growing. When a company doesn't make profits, we'd generally expect to see good revenue growth. As you can imagine, fast revenue growth, when maintained, often leads to fast profit growth.
In the last half decade, Conformis saw its revenue increase by 1.3% per year. That's far from impressive given all the money it is losing. Nonetheless, it's fair to say the rapidly declining share price (down 14%, compound, over five years) suggests the market is very disappointed with this level of growth. While we're definitely wary of the stock, after that kind of performance, it could be an over-reaction. We'd recommend focussing any further research on the likelihood of profitability in the foreseeable future, given the muted revenue growth.
You can see how earnings and revenue have changed over time in the image below (click on the chart to see the exact values).
Take a more thorough look at Conformis' financial health with this free report on its balance sheet.
A Different Perspective
We regret to report that Conformis shareholders are down 71% for the year. Unfortunately, that's worse than the broader market decline of 8.8%. However, it could simply be that the share price has been impacted by broader market jitters. It might be worth keeping an eye on the fundamentals, in case there's a good opportunity. Regrettably, last year's performance caps off a bad run, with the shareholders facing a total loss of 14% per year over five years. We realise that Baron Rothschild has said investors should "buy when there is blood on the streets", but we caution that investors should first be sure they are buying a high quality business. I find it very interesting to look at share price over the long term as a proxy for business performance. But to truly gain insight, we need to consider other information, too. For example, we've discovered 3 warning signs for Conformis that you should be aware of before investing here.
Of course Conformis may not be the best stock to buy. So you may wish to see this free collection of growth stocks.
Please note, the market returns quoted in this article reflect the market weighted average returns of stocks that currently trade on US exchanges.
Have feedback on this article? Concerned about the content? Get in touch with us directly. Alternatively, email editorial-team (at) simplywallst.com.
This article by Simply Wall St is general in nature. We provide commentary based on historical data and analyst forecasts only using an unbiased methodology and our articles are not intended to be financial advice. It does not constitute a recommendation to buy or sell any stock, and does not take account of your objectives, or your financial situation. We aim to bring you long-term focused analysis driven by fundamental data. Note that our analysis may not factor in the latest price-sensitive company announcements or qualitative material. Simply Wall St has no position in any stocks mentioned.
Join A Paid User Research Session
You’ll receive a US$30 Amazon Gift card for 1 hour of your time while helping us build better investing tools for the individual investors like yourself. Sign up here
