
 Yahoo Finance
 Investors Could Be Concerned With Amazon.com's (NASDAQ:AMZN) Returns On Capital
To find a multi-bagger stock, what are the underlying trends we should look for in a business? Firstly, we'd want to identify a growing return on capital employed (ROCE) and then alongside that, an ever-increasing base of capital employed. If you see this, it typically means it's a company with a great business model and plenty of profitable reinvestment opportunities. However, after investigating Amazon.com (NASDAQ:AMZN), we don't think it's current trends fit the mold of a multi-bagger.
Understanding Return On Capital Employed (ROCE)
For those who don't know, ROCE is a measure of a company's yearly pre-tax profit (its return), relative to the capital employed in the business. Analysts use this formula to calculate it for Amazon.com:
Return on Capital Employed = Earnings Before Interest and Tax (EBIT) ÷ (Total Assets - Current Liabilities)
0.10 = US$37b ÷ (US$528b - US$165b) (Based on the trailing twelve months to December 2023).
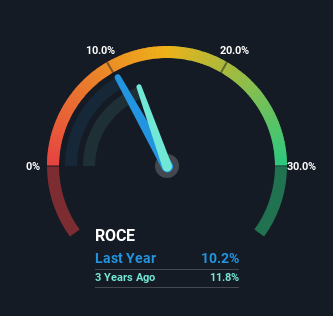
So, Amazon.com has an ROCE of 10%. That's a relatively normal return on capital, and it's around the 11% generated by the Multiline Retail industry.
See our latest analysis for Amazon.com
Above you can see how the current ROCE for Amazon.com compares to its prior returns on capital, but there's only so much you can tell from the past. If you'd like, you can check out the forecasts from the analysts covering Amazon.com for free.
What Does the ROCE Trend For Amazon.com Tell Us?
In terms of Amazon.com's historical ROCE movements, the trend isn't fantastic. Around five years ago the returns on capital were 13%, but since then they've fallen to 10%. Although, given both revenue and the amount of assets employed in the business have increased, it could suggest the company is investing in growth, and the extra capital has led to a short-term reduction in ROCE. And if the increased capital generates additional returns, the business, and thus shareholders, will benefit in the long run.
On a side note, Amazon.com has done well to pay down its current liabilities to 31% of total assets. So we could link some of this to the decrease in ROCE. What's more, this can reduce some aspects of risk to the business because now the company's suppliers or short-term creditors are funding less of its operations. Since the business is basically funding more of its operations with it's own money, you could argue this has made the business less efficient at generating ROCE.
The Bottom Line On Amazon.com's ROCE
In summary, despite lower returns in the short term, we're encouraged to see that Amazon.com is reinvesting for growth and has higher sales as a result. Furthermore the stock has climbed 84% over the last five years, it would appear that investors are upbeat about the future. So while investors seem to be recognizing these promising trends, we would look further into this stock to make sure the other metrics justify the positive view.
If you're still interested in Amazon.com it's worth checking out our FREE intrinsic value approximation for AMZN to see if it's trading at an attractive price in other respects.
While Amazon.com isn't earning the highest return, check out this free list of companies that are earning high returns on equity with solid balance sheets.
Have feedback on this article? Concerned about the content? Get in touch with us directly. Alternatively, email editorial-team (at) simplywallst.com.
This article by Simply Wall St is general in nature. We provide commentary based on historical data and analyst forecasts only using an unbiased methodology and our articles are not intended to be financial advice. It does not constitute a recommendation to buy or sell any stock, and does not take account of your objectives, or your financial situation. We aim to bring you long-term focused analysis driven by fundamental data. Note that our analysis may not factor in the latest price-sensitive company announcements or qualitative material. Simply Wall St has no position in any stocks mentioned.

