
 Yahoo Finance
 Investors Could Be Concerned With Matthews International's (NASDAQ:MATW) Returns On Capital
What underlying fundamental trends can indicate that a company might be in decline? When we see a declining return on capital employed (ROCE) in conjunction with a declining base of capital employed, that's often how a mature business shows signs of aging. Ultimately this means that the company is earning less per dollar invested and on top of that, it's shrinking its base of capital employed. So after glancing at the trends within Matthews International (NASDAQ:MATW), we weren't too hopeful.
What Is Return On Capital Employed (ROCE)?
Just to clarify if you're unsure, ROCE is a metric for evaluating how much pre-tax income (in percentage terms) a company earns on the capital invested in its business. Analysts use this formula to calculate it for Matthews International:
Return on Capital Employed = Earnings Before Interest and Tax (EBIT) ÷ (Total Assets - Current Liabilities)
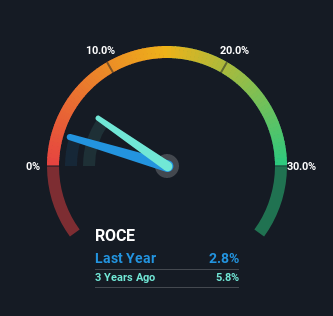
0.028 = US$44m ÷ (US$1.9b - US$310m) (Based on the trailing twelve months to June 2022).
So, Matthews International has an ROCE of 2.8%. In absolute terms, that's a low return and it also under-performs the Commercial Services industry average of 9.3%.
Check out our latest analysis for Matthews International
Above you can see how the current ROCE for Matthews International compares to its prior returns on capital, but there's only so much you can tell from the past. If you're interested, you can view the analysts predictions in our free report on analyst forecasts for the company.
How Are Returns Trending?
There is reason to be cautious about Matthews International, given the returns are trending downwards. About five years ago, returns on capital were 5.2%, however they're now substantially lower than that as we saw above. And on the capital employed front, the business is utilizing roughly the same amount of capital as it was back then. This combination can be indicative of a mature business that still has areas to deploy capital, but the returns received aren't as high due potentially to new competition or smaller margins. So because these trends aren't typically conducive to creating a multi-bagger, we wouldn't hold our breath on Matthews International becoming one if things continue as they have.
The Bottom Line
In summary, it's unfortunate that Matthews International is generating lower returns from the same amount of capital. Investors haven't taken kindly to these developments, since the stock has declined 43% from where it was five years ago. Unless there is a shift to a more positive trajectory in these metrics, we would look elsewhere.
Since virtually every company faces some risks, it's worth knowing what they are, and we've spotted 2 warning signs for Matthews International (of which 1 is potentially serious!) that you should know about.
While Matthews International may not currently earn the highest returns, we've compiled a list of companies that currently earn more than 25% return on equity. Check out this free list here.
Have feedback on this article? Concerned about the content? Get in touch with us directly. Alternatively, email editorial-team (at) simplywallst.com.
This article by Simply Wall St is general in nature. We provide commentary based on historical data and analyst forecasts only using an unbiased methodology and our articles are not intended to be financial advice. It does not constitute a recommendation to buy or sell any stock, and does not take account of your objectives, or your financial situation. We aim to bring you long-term focused analysis driven by fundamental data. Note that our analysis may not factor in the latest price-sensitive company announcements or qualitative material. Simply Wall St has no position in any stocks mentioned.
Join A Paid User Research Session
You’ll receive a US$30 Amazon Gift card for 1 hour of your time while helping us build better investing tools for the individual investors like yourself. Sign up here
