
 Yahoo Finance
 Investors who have held Qurate Retail (NASDAQ:QRTE.A) over the last three years have watched its earnings decline along with their investment
Qurate Retail, Inc. (NASDAQ:QRTE.A) shareholders will doubtless be very grateful to see the share price up 84% in the last month. But that cannot eclipse the less-than-impressive returns over the last three years. After all, the share price is down 65% in the last three years, significantly under-performing the market.
On a more encouraging note the company has added US$222m to its market cap in just the last 7 days, so let's see if we can determine what's driven the three-year loss for shareholders.
See our latest analysis for Qurate Retail
While markets are a powerful pricing mechanism, share prices reflect investor sentiment, not just underlying business performance. One way to examine how market sentiment has changed over time is to look at the interaction between a company's share price and its earnings per share (EPS).
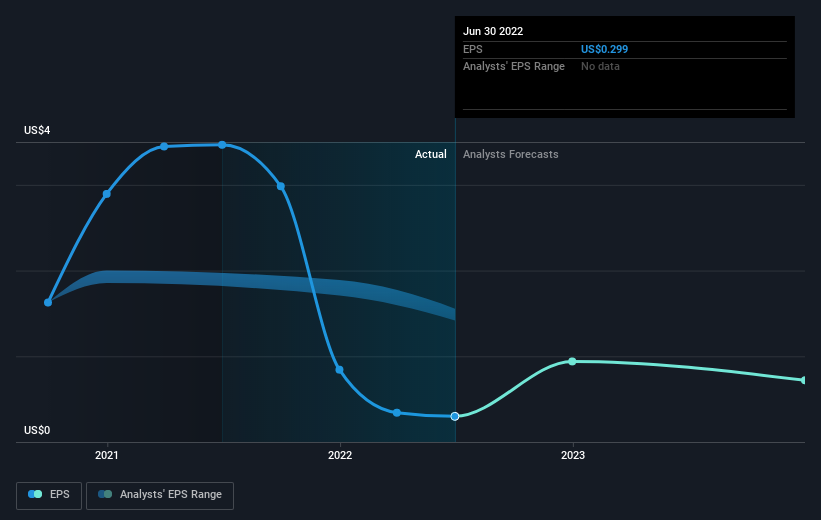
Qurate Retail saw its EPS decline at a compound rate of 36% per year, over the last three years. In comparison the 30% compound annual share price decline isn't as bad as the EPS drop-off. So the market may not be too worried about the EPS figure, at the moment -- or it may have previously priced some of the drop in.
The company's earnings per share (over time) is depicted in the image below (click to see the exact numbers).
Before buying or selling a stock, we always recommend a close examination of historic growth trends, available here.
What About The Total Shareholder Return (TSR)?
Investors should note that there's a difference between Qurate Retail's total shareholder return (TSR) and its share price change, which we've covered above. The TSR attempts to capture the value of dividends (as if they were reinvested) as well as any spin-offs or discounted capital raisings offered to shareholders. We note that Qurate Retail's TSR, at -20% is higher than its share price return of -65%. When you consider it hasn't been paying a dividend, this data suggests shareholders have benefitted from a spin-off, or had the opportunity to acquire attractively priced shares in a discounted capital raising.
A Different Perspective
Qurate Retail shareholders are down 56% for the year, falling short of the market return. The market shed around 7.5%, no doubt weighing on the stock price. The three-year loss of 6% per year isn't as bad as the last twelve months, suggesting that the company has not been able to convince the market it has solved its problems. We would be wary of buying into a company with unsolved problems, although some investors will buy into struggling stocks if they believe the price is sufficiently attractive. I find it very interesting to look at share price over the long term as a proxy for business performance. But to truly gain insight, we need to consider other information, too. For instance, we've identified 3 warning signs for Qurate Retail (1 is a bit unpleasant) that you should be aware of.
If you would prefer to check out another company -- one with potentially superior financials -- then do not miss this free list of companies that have proven they can grow earnings.
Please note, the market returns quoted in this article reflect the market weighted average returns of stocks that currently trade on US exchanges.
Have feedback on this article? Concerned about the content? Get in touch with us directly. Alternatively, email editorial-team (at) simplywallst.com.
This article by Simply Wall St is general in nature. We provide commentary based on historical data and analyst forecasts only using an unbiased methodology and our articles are not intended to be financial advice. It does not constitute a recommendation to buy or sell any stock, and does not take account of your objectives, or your financial situation. We aim to bring you long-term focused analysis driven by fundamental data. Note that our analysis may not factor in the latest price-sensitive company announcements or qualitative material. Simply Wall St has no position in any stocks mentioned.
Join A Paid User Research Session
You’ll receive a US$30 Amazon Gift card for 1 hour of your time while helping us build better investing tools for the individual investors like yourself. Sign up here
