
 Yahoo Finance
 Investors in John Bean Technologies (NYSE:JBT) have unfortunately lost 36% over the last three years
For many investors, the main point of stock picking is to generate higher returns than the overall market. But in any portfolio, there are likely to be some stocks that fall short of that benchmark. Unfortunately, that's been the case for longer term John Bean Technologies Corporation (NYSE:JBT) shareholders, since the share price is down 37% in the last three years, falling well short of the market return of around 12%. More recently, the share price has dropped a further 10% in a month. We do note, however, that the broader market is down 5.3% in that period, and this may have weighed on the share price.
So let's have a look and see if the longer term performance of the company has been in line with the underlying business' progress.
View our latest analysis for John Bean Technologies
While markets are a powerful pricing mechanism, share prices reflect investor sentiment, not just underlying business performance. One imperfect but simple way to consider how the market perception of a company has shifted is to compare the change in the earnings per share (EPS) with the share price movement.
Although the share price is down over three years, John Bean Technologies actually managed to grow EPS by 6.2% per year in that time. Given the share price reaction, one might suspect that EPS is not a good guide to the business performance during the period (perhaps due to a one-off loss or gain). Alternatively, growth expectations may have been unreasonable in the past.
It's worth taking a look at other metrics, because the EPS growth doesn't seem to match with the falling share price.
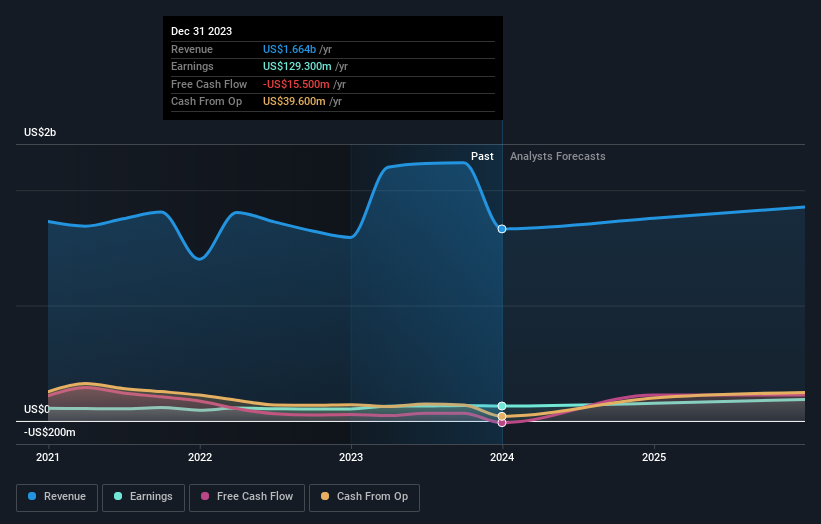
With a rather small yield of just 0.4% we doubt that the stock's share price is based on its dividend. Revenue is actually up 6.9% over the three years, so the share price drop doesn't seem to hinge on revenue, either. It's probably worth investigating John Bean Technologies further; while we may be missing something on this analysis, there might also be an opportunity.
The graphic below depicts how earnings and revenue have changed over time (unveil the exact values by clicking on the image).
We know that John Bean Technologies has improved its bottom line lately, but what does the future have in store? So we recommend checking out this free report showing consensus forecasts
A Different Perspective
While the broader market gained around 21% in the last year, John Bean Technologies shareholders lost 11% (even including dividends). However, keep in mind that even the best stocks will sometimes underperform the market over a twelve month period. Unfortunately, last year's performance may indicate unresolved challenges, given that it was worse than the annualised loss of 3% over the last half decade. Generally speaking long term share price weakness can be a bad sign, though contrarian investors might want to research the stock in hope of a turnaround. Before forming an opinion on John Bean Technologies you might want to consider these 3 valuation metrics.
We will like John Bean Technologies better if we see some big insider buys. While we wait, check out this free list of growing companies with considerable, recent, insider buying.
Please note, the market returns quoted in this article reflect the market weighted average returns of stocks that currently trade on American exchanges.
Have feedback on this article? Concerned about the content? Get in touch with us directly. Alternatively, email editorial-team (at) simplywallst.com.
This article by Simply Wall St is general in nature. We provide commentary based on historical data and analyst forecasts only using an unbiased methodology and our articles are not intended to be financial advice. It does not constitute a recommendation to buy or sell any stock, and does not take account of your objectives, or your financial situation. We aim to bring you long-term focused analysis driven by fundamental data. Note that our analysis may not factor in the latest price-sensitive company announcements or qualitative material. Simply Wall St has no position in any stocks mentioned.
