
 Yahoo Finance
 Investors in Keyera (TSE:KEY) have seen respectable returns of 59% over the past three years
By buying an index fund, you can roughly match the market return with ease. But many of us dare to dream of bigger returns, and build a portfolio ourselves. Just take a look at Keyera Corp. (TSE:KEY), which is up 32%, over three years, soundly beating the market return of 12% (not including dividends). On the other hand, the returns haven't been quite so good recently, with shareholders up just 26% , including dividends .
So let's investigate and see if the longer term performance of the company has been in line with the underlying business' progress.
See our latest analysis for Keyera
There is no denying that markets are sometimes efficient, but prices do not always reflect underlying business performance. One imperfect but simple way to consider how the market perception of a company has shifted is to compare the change in the earnings per share (EPS) with the share price movement.
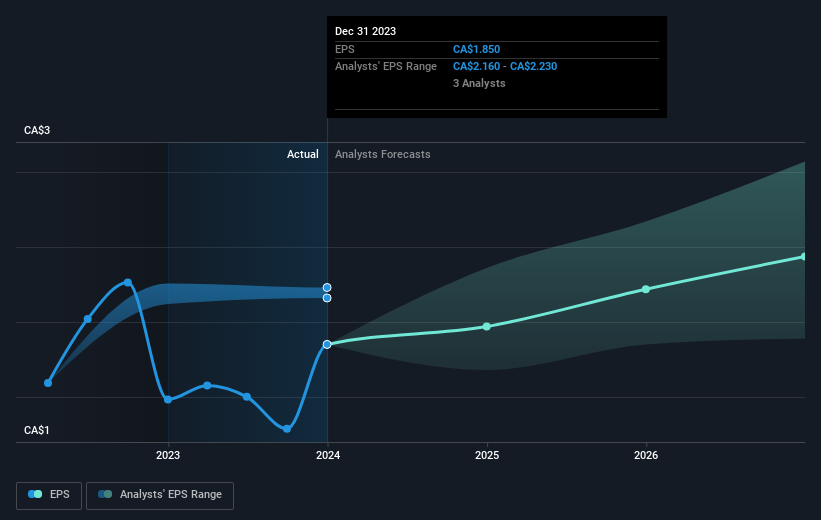
Keyera was able to grow its EPS at 87% per year over three years, sending the share price higher. The average annual share price increase of 10% is actually lower than the EPS growth. So it seems investors have become more cautious about the company, over time.
The company's earnings per share (over time) is depicted in the image below (click to see the exact numbers).
We know that Keyera has improved its bottom line over the last three years, but what does the future have in store? You can see how its balance sheet has strengthened (or weakened) over time in this free interactive graphic.
What About Dividends?
As well as measuring the share price return, investors should also consider the total shareholder return (TSR). The TSR incorporates the value of any spin-offs or discounted capital raisings, along with any dividends, based on the assumption that the dividends are reinvested. Arguably, the TSR gives a more comprehensive picture of the return generated by a stock. In the case of Keyera, it has a TSR of 59% for the last 3 years. That exceeds its share price return that we previously mentioned. This is largely a result of its dividend payments!
A Different Perspective
It's nice to see that Keyera shareholders have received a total shareholder return of 26% over the last year. Of course, that includes the dividend. That's better than the annualised return of 10% over half a decade, implying that the company is doing better recently. Given the share price momentum remains strong, it might be worth taking a closer look at the stock, lest you miss an opportunity. While it is well worth considering the different impacts that market conditions can have on the share price, there are other factors that are even more important. Like risks, for instance. Every company has them, and we've spotted 3 warning signs for Keyera (of which 1 can't be ignored!) you should know about.
But note: Keyera may not be the best stock to buy. So take a peek at this free list of interesting companies with past earnings growth (and further growth forecast).
Please note, the market returns quoted in this article reflect the market weighted average returns of stocks that currently trade on Canadian exchanges.
Have feedback on this article? Concerned about the content? Get in touch with us directly. Alternatively, email editorial-team (at) simplywallst.com.
This article by Simply Wall St is general in nature. We provide commentary based on historical data and analyst forecasts only using an unbiased methodology and our articles are not intended to be financial advice. It does not constitute a recommendation to buy or sell any stock, and does not take account of your objectives, or your financial situation. We aim to bring you long-term focused analysis driven by fundamental data. Note that our analysis may not factor in the latest price-sensitive company announcements or qualitative material. Simply Wall St has no position in any stocks mentioned.
