
 Yahoo Finance
 What Investors Should Know About TOTAL SA’s (EPA:FP) Financial Strength

Investors seeking to preserve capital in a volatile environment might consider large-cap stocks such as TOTAL SA (EPA:FP) a safer option. Risk-averse investors who are attracted to diversified streams of revenue and strong capital returns tend to seek out these large companies. However, its financial health remains the key to continued success. I will provide an overview of TOTAL’s financial liquidity and leverage to give you an idea of TOTAL’s position to take advantage of potential acquisitions or comfortably endure future downturns. Note that this commentary is very high-level and solely focused on financial health, so I suggest you dig deeper yourself into FP here. View out our latest analysis for TOTAL
Does FP produce enough cash relative to debt?
FP’s debt levels have fallen from €57.20b to €52.59b over the last 12 months , which comprises of short- and long-term debt. With this debt payback, FP currently has €36.41b remaining in cash and short-term investments for investing into the business. Moreover, FP has generated €22.32b in operating cash flow over the same time period, leading to an operating cash to total debt ratio of 42.44%, signalling that FP’s current level of operating cash is high enough to cover debt. This ratio can also be interpreted as a measure of efficiency as an alternative to return on assets. In FP’s case, it is able to generate 0.42x cash from its debt capital.
Can FP pay its short-term liabilities?
At the current liabilities level of €56.71b liabilities, it appears that the company has been able to meet these obligations given the level of current assets of €84.95b, with a current ratio of 1.5x. For Oil and Gas companies, this ratio is within a sensible range since there is a bit of a cash buffer without leaving too much capital in a low-return environment.
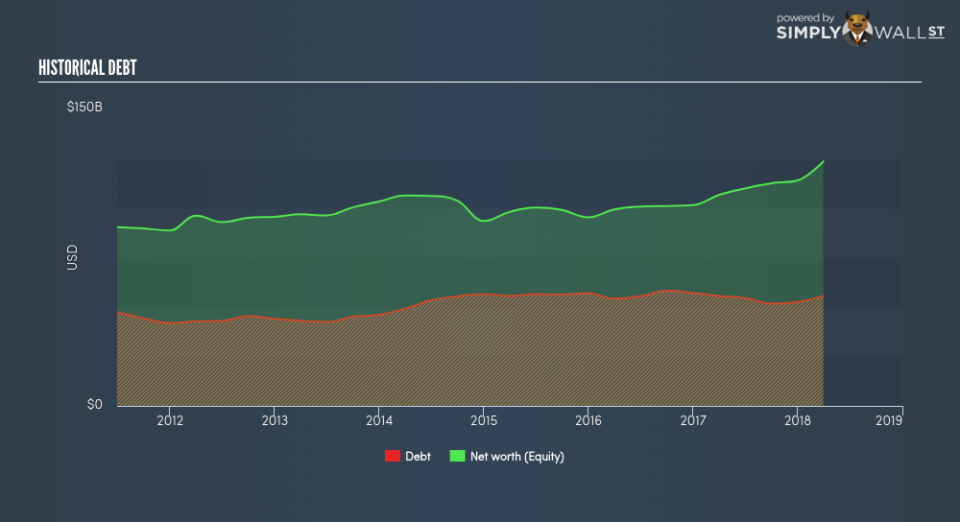
Is FP’s debt level acceptable?
With a debt-to-equity ratio of 44.90%, FP can be considered as an above-average leveraged company. This is not unusual for large-caps since debt tends to be less expensive than equity because interest payments are tax deductible. Consequently, larger-cap organisations tend to enjoy lower cost of capital as a result of easily attained financing, providing an advantage over smaller companies. No matter how high the company’s debt, if it can easily cover the interest payments, it’s considered to be efficient with its use of excess leverage. A company generating earnings after interest and tax at least three times its net interest payments is considered financially sound. For FP, the ratio of 18.11x suggests that interest is comfortably covered. High interest coverage is seen as a responsible and safe practice, which highlights why most investors believe large-caps such as FP is a safe investment.
Next Steps:
FP’s high cash coverage means that, although its debt levels are high, the company is able to utilise its borrowings efficiently in order to generate cash flow. Since there is also no concerns around FP’s liquidity needs, this may be its optimal capital structure for the time being. Keep in mind I haven’t considered other factors such as how FP has been performing in the past. I suggest you continue to research TOTAL to get a better picture of the large-cap by looking at:
Future Outlook: What are well-informed industry analysts predicting for FP’s future growth? Take a look at our free research report of analyst consensus for FP’s outlook.
Valuation: What is FP worth today? Is the stock undervalued, even when its growth outlook is factored into its intrinsic value? The intrinsic value infographic in our free research report helps visualize whether FP is currently mispriced by the market.
Other High-Performing Stocks: Are there other stocks that provide better prospects with proven track records? Explore our free list of these great stocks here.
To help readers see pass the short term volatility of the financial market, we aim to bring you a long-term focused research analysis purely driven by fundamental data. Note that our analysis does not factor in the latest price sensitive company announcements.
The author is an independent contributor and at the time of publication had no position in the stocks mentioned.
