
 Yahoo Finance
 Investors in Ora Banda Mining (ASX:OBM) from three years ago are still down 51%, even after 11% gain this past week
Ora Banda Mining Limited (ASX:OBM) shareholders will doubtless be very grateful to see the share price up 63% in the last quarter. But over the last three years we've seen a quite serious decline. Regrettably, the share price slid 56% in that period. Some might say the recent bounce is to be expected after such a bad drop. The rise has some hopeful, but turnarounds are often precarious.
On a more encouraging note the company has added AU$11m to its market cap in just the last 7 days, so let's see if we can determine what's driven the three-year loss for shareholders.
Check out our latest analysis for Ora Banda Mining
Ora Banda Mining isn't currently profitable, so most analysts would look to revenue growth to get an idea of how fast the underlying business is growing. Generally speaking, companies without profits are expected to grow revenue every year, and at a good clip. As you can imagine, fast revenue growth, when maintained, often leads to fast profit growth.
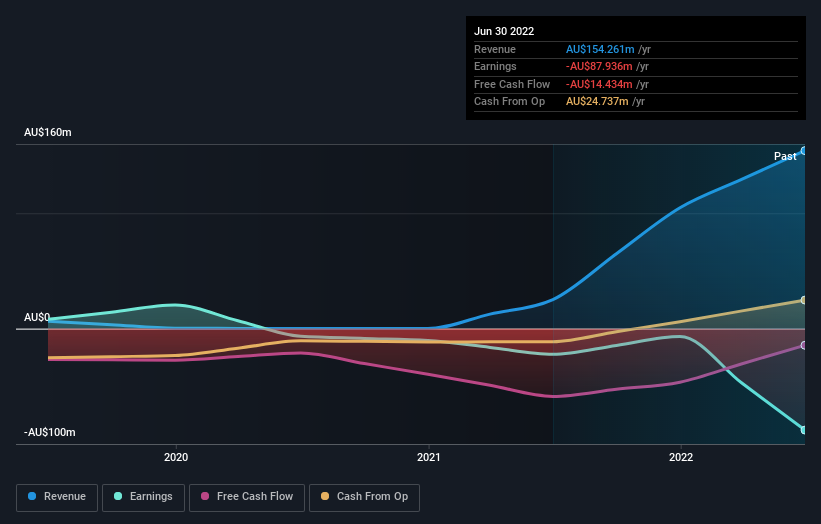
Over three years, Ora Banda Mining grew revenue at 125% per year. That's well above most other pre-profit companies. In contrast, the share price is down 16% compound, over three years - disappointing by most standards. This could mean hype has come out of the stock because the losses are concerning investors. When we see revenue growth, paired with a falling share price, we can't help wonder if there is an opportunity for those who are willing to dig deeper.
The graphic below depicts how earnings and revenue have changed over time (unveil the exact values by clicking on the image).
You can see how its balance sheet has strengthened (or weakened) over time in this free interactive graphic.
What About The Total Shareholder Return (TSR)?
We'd be remiss not to mention the difference between Ora Banda Mining's total shareholder return (TSR) and its share price return. Arguably the TSR is a more complete return calculation because it accounts for the value of dividends (as if they were reinvested), along with the hypothetical value of any discounted capital that have been offered to shareholders. We note that Ora Banda Mining's TSR, at -51% is higher than its share price return of -56%. When you consider it hasn't been paying a dividend, this data suggests shareholders have benefitted from a spin-off, or had the opportunity to acquire attractively priced shares in a discounted capital raising.
A Different Perspective
Ora Banda Mining shareholders are down 10% for the year, falling short of the market return. The market shed around 4.7%, no doubt weighing on the stock price. Unfortunately, the longer term story isn't pretty, with investment losses running at 15% per year over three years. We would want clear information suggesting the company will grow, before taking the view that the share price will stabilize. I find it very interesting to look at share price over the long term as a proxy for business performance. But to truly gain insight, we need to consider other information, too. Take risks, for example - Ora Banda Mining has 3 warning signs we think you should be aware of.
But note: Ora Banda Mining may not be the best stock to buy. So take a peek at this free list of interesting companies with past earnings growth (and further growth forecast).
Please note, the market returns quoted in this article reflect the market weighted average returns of stocks that currently trade on AU exchanges.
Have feedback on this article? Concerned about the content? Get in touch with us directly. Alternatively, email editorial-team (at) simplywallst.com.
This article by Simply Wall St is general in nature. We provide commentary based on historical data and analyst forecasts only using an unbiased methodology and our articles are not intended to be financial advice. It does not constitute a recommendation to buy or sell any stock, and does not take account of your objectives, or your financial situation. We aim to bring you long-term focused analysis driven by fundamental data. Note that our analysis may not factor in the latest price-sensitive company announcements or qualitative material. Simply Wall St has no position in any stocks mentioned.
Join A Paid User Research Session
You’ll receive a US$30 Amazon Gift card for 1 hour of your time while helping us build better investing tools for the individual investors like yourself. Sign up here
