
 Yahoo Finance
 Investors in Royalty Pharma (NASDAQ:RPRX) have unfortunately lost 18% over the last year
It's easy to match the overall market return by buying an index fund. But if you buy individual stocks, you can do both better or worse than that. That downside risk was realized by Royalty Pharma plc (NASDAQ:RPRX) shareholders over the last year, as the share price declined 19%. That's well below the market decline of 3.8%. Because Royalty Pharma hasn't been listed for many years, the market is still learning about how the business performs.
Since shareholders are down over the longer term, lets look at the underlying fundamentals over the that time and see if they've been consistent with returns.
View our latest analysis for Royalty Pharma
While markets are a powerful pricing mechanism, share prices reflect investor sentiment, not just underlying business performance. One way to examine how market sentiment has changed over time is to look at the interaction between a company's share price and its earnings per share (EPS).
During the unfortunate twelve months during which the Royalty Pharma share price fell, it actually saw its earnings per share (EPS) improve by 13%. It's quite possible that growth expectations may have been unreasonable in the past.
It's fair to say that the share price does not seem to be reflecting the EPS growth. But we might find some different metrics explain the share price movements better.
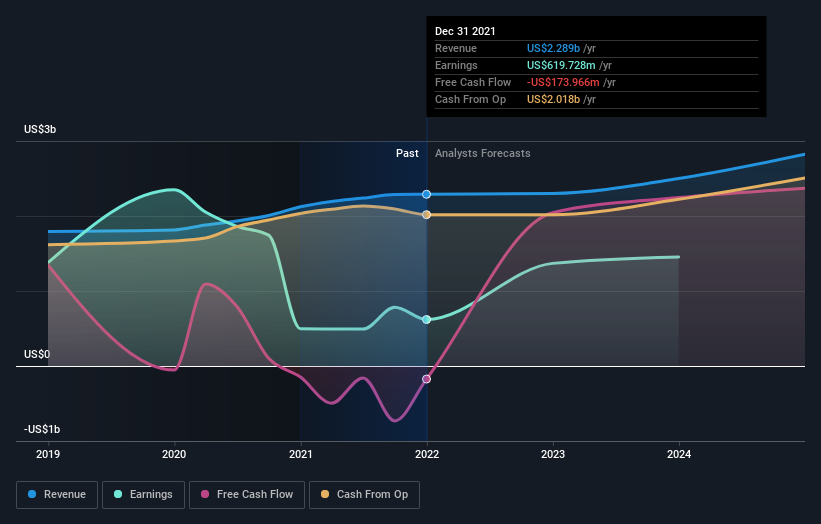
Royalty Pharma's revenue is actually up 7.9% over the last year. Since we can't easily explain the share price movement based on these metrics, it might be worth considering how market sentiment has changed towards the stock.
The graphic below depicts how earnings and revenue have changed over time (unveil the exact values by clicking on the image).
It's good to see that there was some significant insider buying in the last three months. That's a positive. That said, we think earnings and revenue growth trends are even more important factors to consider. So it makes a lot of sense to check out what analysts think Royalty Pharma will earn in the future (free profit forecasts).
A Different Perspective
We doubt Royalty Pharma shareholders are happy with the loss of 18% over twelve months (even including dividends). That falls short of the market, which lost 3.8%. There's no doubt that's a disappointment, but the stock may well have fared better in a stronger market. It's great to see a nice little 1.1% rebound in the last three months. This could just be a bounce because the selling was too aggressive, but fingers crossed it's the start of a new trend. While it is well worth considering the different impacts that market conditions can have on the share price, there are other factors that are even more important. For instance, we've identified 3 warning signs for Royalty Pharma that you should be aware of.
There are plenty of other companies that have insiders buying up shares. You probably do not want to miss this free list of growing companies that insiders are buying.
Please note, the market returns quoted in this article reflect the market weighted average returns of stocks that currently trade on US exchanges.
Have feedback on this article? Concerned about the content? Get in touch with us directly. Alternatively, email editorial-team (at) simplywallst.com.
This article by Simply Wall St is general in nature. We provide commentary based on historical data and analyst forecasts only using an unbiased methodology and our articles are not intended to be financial advice. It does not constitute a recommendation to buy or sell any stock, and does not take account of your objectives, or your financial situation. We aim to bring you long-term focused analysis driven by fundamental data. Note that our analysis may not factor in the latest price-sensitive company announcements or qualitative material. Simply Wall St has no position in any stocks mentioned.
