
 Yahoo Finance
 Investors three-year losses continue as Sealed Air (NYSE:SEE) dips a further 4.0% this week, earnings continue to decline
Sealed Air Corporation (NYSE:SEE) shareholders should be happy to see the share price up 19% in the last month. But that cannot eclipse the less-than-impressive returns over the last three years. In fact, the share price is down 34% in the last three years, falling well short of the market return.
After losing 4.0% this past week, it's worth investigating the company's fundamentals to see what we can infer from past performance.
Check out our latest analysis for Sealed Air
There is no denying that markets are sometimes efficient, but prices do not always reflect underlying business performance. By comparing earnings per share (EPS) and share price changes over time, we can get a feel for how investor attitudes to a company have morphed over time.
During the three years that the share price fell, Sealed Air's earnings per share (EPS) dropped by 6.9% each year. This reduction in EPS is slower than the 13% annual reduction in the share price. So it seems the market was too confident about the business, in the past.
The company's earnings per share (over time) is depicted in the image below (click to see the exact numbers).
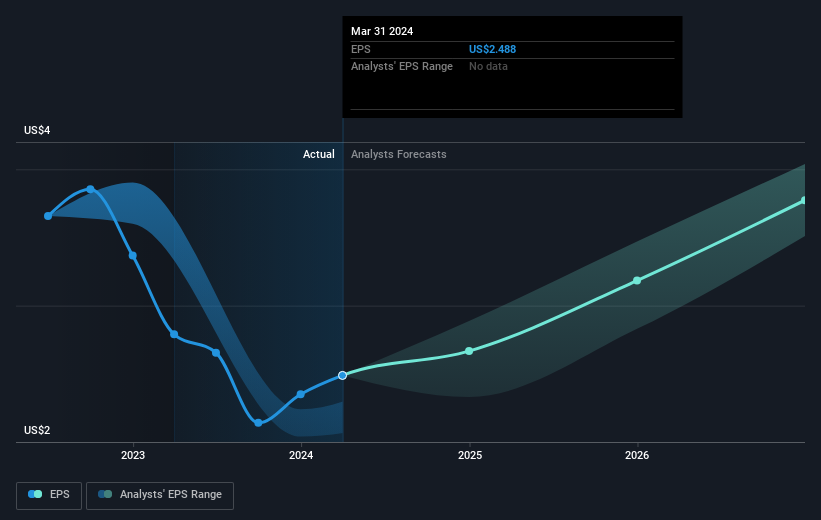
We consider it positive that insiders have made significant purchases in the last year. Having said that, most people consider earnings and revenue growth trends to be a more meaningful guide to the business. It might be well worthwhile taking a look at our free report on Sealed Air's earnings, revenue and cash flow.
What About Dividends?
When looking at investment returns, it is important to consider the difference between total shareholder return (TSR) and share price return. The TSR incorporates the value of any spin-offs or discounted capital raisings, along with any dividends, based on the assumption that the dividends are reinvested. Arguably, the TSR gives a more comprehensive picture of the return generated by a stock. We note that for Sealed Air the TSR over the last 3 years was -31%, which is better than the share price return mentioned above. This is largely a result of its dividend payments!
A Different Perspective
Sealed Air shareholders are down 4.9% for the year (even including dividends), but the market itself is up 28%. However, keep in mind that even the best stocks will sometimes underperform the market over a twelve month period. Regrettably, last year's performance caps off a bad run, with the shareholders facing a total loss of 0.3% per year over five years. We realise that Baron Rothschild has said investors should "buy when there is blood on the streets", but we caution that investors should first be sure they are buying a high quality business. I find it very interesting to look at share price over the long term as a proxy for business performance. But to truly gain insight, we need to consider other information, too. For instance, we've identified 2 warning signs for Sealed Air (1 is a bit concerning) that you should be aware of.
Sealed Air is not the only stock that insiders are buying. For those who like to find lesser know companies this free list of growing companies with recent insider purchasing, could be just the ticket.
Please note, the market returns quoted in this article reflect the market weighted average returns of stocks that currently trade on American exchanges.
Have feedback on this article? Concerned about the content? Get in touch with us directly. Alternatively, email editorial-team (at) simplywallst.com.
This article by Simply Wall St is general in nature. We provide commentary based on historical data and analyst forecasts only using an unbiased methodology and our articles are not intended to be financial advice. It does not constitute a recommendation to buy or sell any stock, and does not take account of your objectives, or your financial situation. We aim to bring you long-term focused analysis driven by fundamental data. Note that our analysis may not factor in the latest price-sensitive company announcements or qualitative material. Simply Wall St has no position in any stocks mentioned.
