
 Yahoo Finance
 Investors in Tower (NZSE:TWR) have unfortunately lost 12% over the last year
It's easy to match the overall market return by buying an index fund. When you buy individual stocks, you can make higher profits, but you also face the risk of under-performance. Investors in Tower Limited (NZSE:TWR) have tasted that bitter downside in the last year, as the share price dropped 17%. That's disappointing when you consider the market declined 2.5%. Even if shareholders bought some time ago, they wouldn't be particularly happy: the stock is down 14% in three years.
It's worthwhile assessing if the company's economics have been moving in lockstep with these underwhelming shareholder returns, or if there is some disparity between the two. So let's do just that.
Check out our latest analysis for Tower
To quote Buffett, 'Ships will sail around the world but the Flat Earth Society will flourish. There will continue to be wide discrepancies between price and value in the marketplace...' One flawed but reasonable way to assess how sentiment around a company has changed is to compare the earnings per share (EPS) with the share price.
Unfortunately Tower reported an EPS drop of 86% for the last year. This fall in the EPS is significantly worse than the 17% the share price fall. So the market may not be too worried about the EPS figure, at the moment -- or it may have expected earnings to drop faster. Indeed, with a P/E ratio of 98.42 there is obviously some real optimism that earnings will bounce back.
The company's earnings per share (over time) is depicted in the image below (click to see the exact numbers).
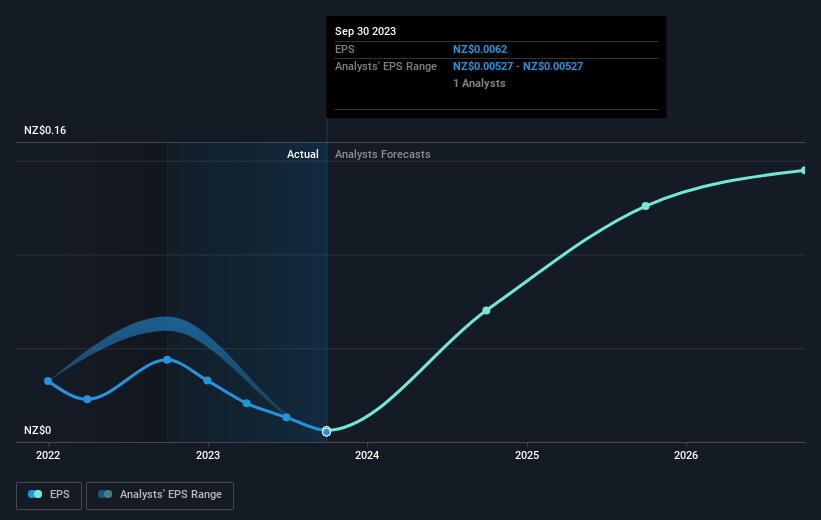
This free interactive report on Tower's earnings, revenue and cash flow is a great place to start, if you want to investigate the stock further.
What About The Total Shareholder Return (TSR)?
We'd be remiss not to mention the difference between Tower's total shareholder return (TSR) and its share price return. The TSR attempts to capture the value of dividends (as if they were reinvested) as well as any spin-offs or discounted capital raisings offered to shareholders. Dividends have been really beneficial for Tower shareholders, and that cash payout explains why its total shareholder loss of 12%, over the last 1 year, isn't as bad as the share price return.
A Different Perspective
While the broader market gained around 2.5% in the last year, Tower shareholders lost 12%. However, keep in mind that even the best stocks will sometimes underperform the market over a twelve month period. Longer term investors wouldn't be so upset, since they would have made 0.6%, each year, over five years. It could be that the recent sell-off is an opportunity, so it may be worth checking the fundamental data for signs of a long term growth trend. While it is well worth considering the different impacts that market conditions can have on the share price, there are other factors that are even more important. To that end, you should be aware of the 2 warning signs we've spotted with Tower .
If you are like me, then you will not want to miss this free list of growing companies that insiders are buying.
Please note, the market returns quoted in this article reflect the market weighted average returns of stocks that currently trade on New Zealander exchanges.
Have feedback on this article? Concerned about the content? Get in touch with us directly. Alternatively, email editorial-team (at) simplywallst.com.
This article by Simply Wall St is general in nature. We provide commentary based on historical data and analyst forecasts only using an unbiased methodology and our articles are not intended to be financial advice. It does not constitute a recommendation to buy or sell any stock, and does not take account of your objectives, or your financial situation. We aim to bring you long-term focused analysis driven by fundamental data. Note that our analysis may not factor in the latest price-sensitive company announcements or qualitative material. Simply Wall St has no position in any stocks mentioned.
