
 Yahoo Finance
 Investors Are Undervaluing Prudential Financial Inc (NYSE:PRU) By 32%

Pricing PRU, a financial stock, can be difficult since these insurance businesses have cash flows that are affected by regulations that are not imposed upon other sectors. For example, insurance firms don’t have gross profits as such, but gross written premiums play a huge part in forecasting cash flows. Focusing on data points like book values, with the return and cost of equity, can be suitable for determining PRU’s value. Today I’ll look at how to value PRU in a fairly useful and straightforward method. Check out our latest analysis for Prudential Financial
Why Excess Return Model?
Before we begin, remember that financial stocks differ in terms of regulation and balance sheet composition. PRU operates in United States which has stringent financial regulations. Furthermore, insurance companies generally don’t hold substantial amounts of tangible assets on their books. So the Excess Returns model is suitable for determining the intrinsic value of PRU rather than the traditional discounted cash flow model, which places emphasis on factors such as depreciation and capex.
How Does It Work?
The main belief for Excess Returns is, the value of the company is how much money it can generate from its current level of equity capital, in excess of the cost of that capital. The returns above the cost of equity is known as excess returns:
Excess Return Per Share = (Stable Return On Equity – Cost Of Equity) (Book Value Of Equity Per Share)
= (11.87% – 10.96%) * $131.54 = $1.2
Excess Return Per Share is used to calculate the terminal value of PRU, which is how much the business is expected to continue to generate over the upcoming years, in perpetuity. This is a common component of discounted cash flow models:
Terminal Value Per Share = Excess Return Per Share / (Cost of Equity – Expected Growth Rate)
= $1.2 / (10.96% – 2.95%) = $14.97
Putting this all together, we get the value of PRU’s share:
Value Per Share = Book Value of Equity Per Share + Terminal Value Per Share
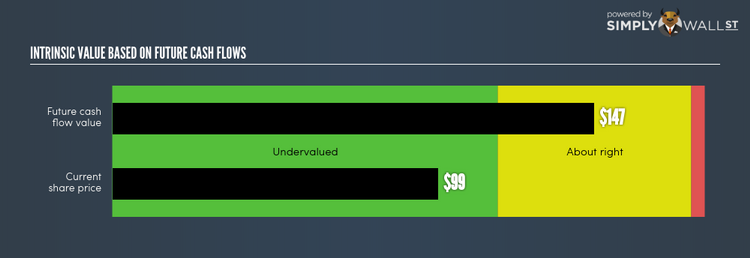
= $131.54 + $14.97 = $146.51
Relative to today’s price of $99.17, PRU is trading below what it’s actually worth. This means there’s an upside to buying PRU today. Pricing is one part of the analysis of your potential investment in PRU. Fundamental factors are key to determining if PRU fits with the rest of your portfolio holdings.
Next Steps:
For insurance companies, there are three key aspects you should look at:
Financial health: Does it have a healthy balance sheet? Take a look at our free bank analysis with six simple checks on things like leverage and risk.
Future earnings: What does the market think of PRU going forward? Our analyst growth expectation chart helps visualize PRU’s growth potential over the upcoming years.
Dividends: Most people buy financial stocks for their healthy and stable dividends. Check out whether PRU is a dividend Rockstar with our historical and future dividend analysis.
For more details and sources, take a look at our full calculation on PRU here.
To help readers see pass the short term volatility of the financial market, we aim to bring you a long-term focused research analysis purely driven by fundamental data. Note that our analysis does not factor in the latest price sensitive company announcements.
The author is an independent contributor and at the time of publication had no position in the stocks mentioned.
