
 Yahoo Finance
 Investors Will Want Park Aerospace's (NYSE:PKE) Growth In ROCE To Persist
What trends should we look for it we want to identify stocks that can multiply in value over the long term? Ideally, a business will show two trends; firstly a growing return on capital employed (ROCE) and secondly, an increasing amount of capital employed. If you see this, it typically means it's a company with a great business model and plenty of profitable reinvestment opportunities. Speaking of which, we noticed some great changes in Park Aerospace's (NYSE:PKE) returns on capital, so let's have a look.
Return On Capital Employed (ROCE): What Is It?
For those who don't know, ROCE is a measure of a company's yearly pre-tax profit (its return), relative to the capital employed in the business. Analysts use this formula to calculate it for Park Aerospace:
Return on Capital Employed = Earnings Before Interest and Tax (EBIT) ÷ (Total Assets - Current Liabilities)
0.066 = US$8.0m ÷ (US$128m - US$6.4m) (Based on the trailing twelve months to November 2023).
Thus, Park Aerospace has an ROCE of 6.6%. Ultimately, that's a low return and it under-performs the Aerospace & Defense industry average of 9.8%.
View our latest analysis for Park Aerospace
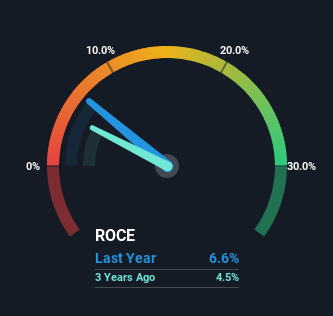
While the past is not representative of the future, it can be helpful to know how a company has performed historically, which is why we have this chart above. If you'd like to look at how Park Aerospace has performed in the past in other metrics, you can view this free graph of Park Aerospace's past earnings, revenue and cash flow.
The Trend Of ROCE
You'd find it hard not to be impressed with the ROCE trend at Park Aerospace. The data shows that returns on capital have increased by 155% over the trailing five years. That's a very favorable trend because this means that the company is earning more per dollar of capital that's being employed. Interestingly, the business may be becoming more efficient because it's applying 26% less capital than it was five years ago. Park Aerospace may be selling some assets so it's worth investigating if the business has plans for future investments to increase returns further still.
The Bottom Line On Park Aerospace's ROCE
In a nutshell, we're pleased to see that Park Aerospace has been able to generate higher returns from less capital. Since the stock has only returned 38% to shareholders over the last five years, the promising fundamentals may not be recognized yet by investors. So exploring more about this stock could uncover a good opportunity, if the valuation and other metrics stack up.
If you'd like to know about the risks facing Park Aerospace, we've discovered 2 warning signs that you should be aware of.
If you want to search for solid companies with great earnings, check out this free list of companies with good balance sheets and impressive returns on equity.
Have feedback on this article? Concerned about the content? Get in touch with us directly. Alternatively, email editorial-team (at) simplywallst.com.
This article by Simply Wall St is general in nature. We provide commentary based on historical data and analyst forecasts only using an unbiased methodology and our articles are not intended to be financial advice. It does not constitute a recommendation to buy or sell any stock, and does not take account of your objectives, or your financial situation. We aim to bring you long-term focused analysis driven by fundamental data. Note that our analysis may not factor in the latest price-sensitive company announcements or qualitative material. Simply Wall St has no position in any stocks mentioned.
