
 Yahoo Finance
 Investors in New Zealand Oil & Gas (NZSE:NZO) have seen returns of 27% over the past year
Passive investing in index funds can generate returns that roughly match the overall market. But one can do better than that by picking better than average stocks (as part of a diversified portfolio). To wit, the New Zealand Oil & Gas Limited (NZSE:NZO) share price is 18% higher than it was a year ago, much better than the market decline of around 5.8% (not including dividends) in the same period. That's a solid performance by our standards! However, the stock hasn't done so well in the longer term, with the stock only up 1.2% in three years.
So let's investigate and see if the longer term performance of the company has been in line with the underlying business' progress.
Check out our latest analysis for New Zealand Oil & Gas
While the efficient markets hypothesis continues to be taught by some, it has been proven that markets are over-reactive dynamic systems, and investors are not always rational. One flawed but reasonable way to assess how sentiment around a company has changed is to compare the earnings per share (EPS) with the share price.
New Zealand Oil & Gas was able to grow EPS by 50% in the last twelve months. It's fair to say that the share price gain of 18% did not keep pace with the EPS growth. So it seems like the market has cooled on New Zealand Oil & Gas, despite the growth. Interesting. This cautious sentiment is reflected in its (fairly low) P/E ratio of 6.75.
The image below shows how EPS has tracked over time (if you click on the image you can see greater detail).
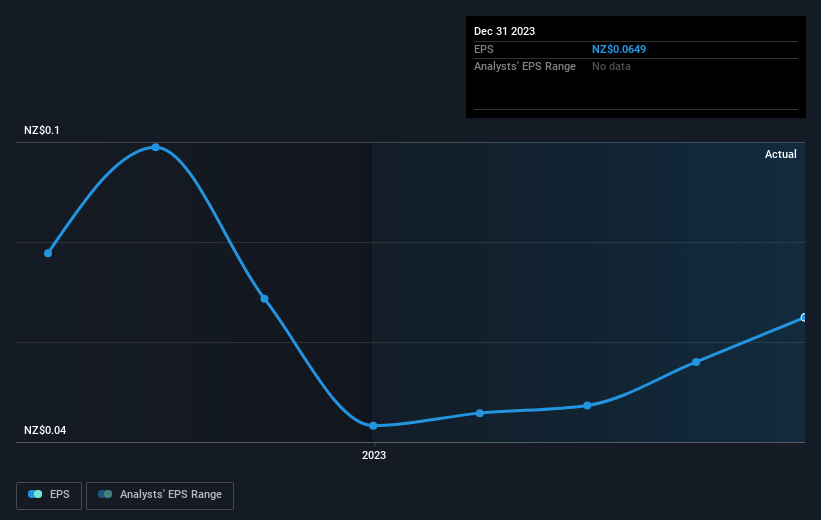
It might be well worthwhile taking a look at our free report on New Zealand Oil & Gas' earnings, revenue and cash flow.
What About The Total Shareholder Return (TSR)?
Investors should note that there's a difference between New Zealand Oil & Gas' total shareholder return (TSR) and its share price change, which we've covered above. The TSR is a return calculation that accounts for the value of cash dividends (assuming that any dividend received was reinvested) and the calculated value of any discounted capital raisings and spin-offs. Dividends have been really beneficial for New Zealand Oil & Gas shareholders, and that cash payout contributed to why its TSR of 27%, over the last 1 year, is better than the share price return.
A Different Perspective
We're pleased to report that New Zealand Oil & Gas shareholders have received a total shareholder return of 27% over one year. That's better than the annualised return of 0.7% over half a decade, implying that the company is doing better recently. Someone with an optimistic perspective could view the recent improvement in TSR as indicating that the business itself is getting better with time. I find it very interesting to look at share price over the long term as a proxy for business performance. But to truly gain insight, we need to consider other information, too. Case in point: We've spotted 2 warning signs for New Zealand Oil & Gas you should be aware of.
If you would prefer to check out another company -- one with potentially superior financials -- then do not miss this free list of companies that have proven they can grow earnings.
Please note, the market returns quoted in this article reflect the market weighted average returns of stocks that currently trade on New Zealander exchanges.
Have feedback on this article? Concerned about the content? Get in touch with us directly. Alternatively, email editorial-team (at) simplywallst.com.
This article by Simply Wall St is general in nature. We provide commentary based on historical data and analyst forecasts only using an unbiased methodology and our articles are not intended to be financial advice. It does not constitute a recommendation to buy or sell any stock, and does not take account of your objectives, or your financial situation. We aim to bring you long-term focused analysis driven by fundamental data. Note that our analysis may not factor in the latest price-sensitive company announcements or qualitative material. Simply Wall St has no position in any stocks mentioned.
