
 Yahoo Finance
 J&J's (JNJ) Q2 Earnings Beat on Higher Cancer Drug Sales
Johnson & Johnson JNJ set the 2018 pharma earnings in motion by beating the Zacks Consensus Estimate on both counts in the second quarter of 2018. The drug and consumer products giant however narrowed its full year sales forecast, due to lower-than-previously expected currency tailwinds. The guidance cut pulled down shares initially in pre-market trading. However, the stock picked up thereafter and rose 1.4% in pre-market trading.
This year so far, J&J’s shares have declined 10.7%, comparing unfavorably with the 0.9% decline witnessed by the industry.

Earnings Beat
J&J’s second-quarter 2018 earnings came in at $2.10 per share, beating the Zacks Consensus Estimate of $2.06 and increasing 14.8% from the year-ago period.
Adjusted earnings excluded amortization expense and some special items. Including these items, J&J reported second-quarter earnings of $1.45 per share, up 3.6% year over year.
Sales Beat
Sales came in at $20.83 billion, beating the Zacks Consensus Estimate of $20.21 billion. Sales also increased 10.6% from the year-ago quarter, reflecting an operational increase of 8.7% and a positive currency impact of 1.9%.
Organically, excluding the impact of acquisitions and divestitures, sales increased 6.3% on an operational basis, better than 4.3% increase seen in the first quarter. This is because of double-digit growth in the Pharmaceutical segment and continued improved performance in the Medical Devices segment. However, the Consumer unit lagged in the quarter.
Second-quarter sales grew 9.4% in the domestic market to $10.64 billion and 11.8% in international markets to $10.19 billion, reflecting 7.9% operational growth and 3.9% positive currency impact.
Sales in Details
Pharmaceutical segment sales rose 19.9% year over year to $10.35 billion, reflecting 17.6% operational growth and 2.3% positive currency impact as sales rose in both domestic and international markets. Sales in the domestic market rose 17.7% to $5.9 billion. International sales grew 22.9% to $4.46 billion (operational increase of 17.5%).
New products like Imbruvica (cancer) and Darzalex (multiple myeloma) continued to perform well. Core products like Xarelto, Stelara, Zytiga, Simponi/Simponi Aria and Invega Sustenna also contributed to growth. Please note that J&J markets Imbruvica in partnership with AbbVie, Inc. ABBV.
Organically, excluding the impact of acquisitions and divestitures, sales increased 11% on an operational basis, much better than 7.5% growth seen in the previous quarter. The strong performance was led by the company’s oncology portfolio. Worldwide sales of J&J’s cancer drugs rose 42.2% in the quarter.
In the quarter, J&J recorded pulmonary arterial hypertension (PAH) revenues of $665 million, better than $585 million in the previous quarter. The $30 billion acquisition of Swiss biotech, Actelion in June last year diversified J&J’s revenues to the PAH category and added 6.6% to sales growth in the quarter.
However, sales of Invokana/Invokamet declined 27.1% due to higher managed care discounting and market share decline due to competitive pressure.
Importantly, sales of the blockbuster rheumatoid arthritis drug, Remicade, marketed in partnership with Merck & Co., Inc. MRK, were down 13.7% in the quarter with U.S. sales declining 13.7% and U.S. exports going down by 18.1%. Remicade sales declined 12.1% in international markets due to biosimilar competition.
Medical Devices segment sales came in at $6.97 billion, up 3.7% from the year-ago period. It included an operational increase of 1.9% and positive currency movement of 1.8%.
Domestic market sales rose 1.1% year over year to $3.27 billion. International market sales increased 6% (operational increase of 2.5%) year over year to $3.7 billion.
The Consumer segment recorded revenues of $3.5 billion in the reported quarter, up 0.7% year over year. However, on an operational basis, Consumer segment sales declined 0.4%. Foreign currency movement positively impacted sales in the segment by 1.1%. Sales in the domestic market declined 0.7% from the year-ago period to $1.48 billion.
Meanwhile, the international segment recorded an increase of 1.9% to $2.03 billion coming entirely from the positive currency impact while operational increase was flat in the quarter.
2018 Sales Outlook Trimmed
J&J tightened its previously issued earnings guidance for 2018 while lowering its sales range. The guidance cut was due to less favorable currency impact owing to a strengthening dollar.
J&J’s new Chief Financial Officer Joe Wolk told CNBC that J&J’s operational performance continues to do “extremely well”. So, J&J actually expects an increase in expected operational growth.
J&J expects 2018 adjusted earnings per share in the range of $8.07 - $8.17 compared with $8.00 - $8.20 expected previously. The guidance range reflects an operational growth rate between 8.5% and 9.9% (previously 6.8% and 9.6%).
Revenues are expected in the range of $80.5 to $81.3 billion, lower than $81.0 to $81.8 billion, reflecting operational constant currency sales growth rate in the range of 4.5% to 5.5% (previously 4% to 5%).
Our Take
Though quite a few key products in J&J’s portfolio like Remicade and Concerta face generic competition, we believe that new products like plaque psoriasis drug, Tremfya (guselkumab), successful label expansion of cancer drugs like Imbruvica and Darzalex and Zytiga, currency tailwinds and contribution from acquisitions helped J&J deliver strong sales and profit in the second quarter of the year. In fact, J&J is quite confident that its Pharma segment will continue to perform better than the market this year despite the impact of biosimilars on Remicade sales.
J&J has been in trouble lately amid lawsuits related to its talc-based products, including its baby powders. Last week, it was ordered by a jury in a St. Louis court to pay $4.69 billion in damages to 22 women who alleged that its talc-based products, including its baby powders, contained asbestos, which was responsible for them to develop ovarian cancer. &J aims to appeal the decision.
J&J currently carries a Zacks Rank #3 (Hold). You can see the complete list of today’s Zacks #1 Rank (Strong Buy) stocks here.
A better-ranked biotech stock is Alexion Pharmaceuticals, Inc. ALXN, carrying a Zacks Rank #2 (Buy). Shares of Alexion have gained 12.5% this year so far.
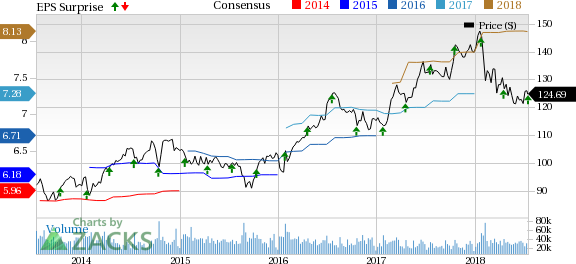
Johnson & Johnson Price, Consensus and EPS Surprise
Johnson & Johnson Price, Consensus and EPS Surprise | Johnson & Johnson Quote
Today's Stocks from Zacks' Hottest Strategies
It's hard to believe, even for us at Zacks. But while the market gained +21.9% in 2017, our top stock-picking screens have returned +115.0%, +109.3%, +104.9%, +98.6%, and +67.1%.
And this outperformance has not just been a recent phenomenon. Over the years it has been remarkably consistent. From 2000 - 2017, the composite yearly average gain for these strategies has beaten the market more than 19X over. Maybe even more remarkable is the fact that we're willing to share their latest stocks with you without cost or obligation.
See Them Free>>
Want the latest recommendations from Zacks Investment Research? Today, you can download 7 Best Stocks for the Next 30 Days. Click to get this free report
Johnson & Johnson (JNJ) : Free Stock Analysis Report
Merck & Co., Inc. (MRK) : Free Stock Analysis Report
AbbVie Inc. (ABBV) : Free Stock Analysis Report
Alexion Pharmaceuticals, Inc. (ALXN) : Free Stock Analysis Report
To read this article on Zacks.com click here.
