
 Yahoo Finance
 Jack Henry & Associates Second Quarter 2023 Earnings: Misses Expectations
Jack Henry & Associates (NASDAQ:JKHY) Second Quarter 2023 Results
Key Financial Results
Revenue: US$505.3m (up 2.3% from 2Q 2022).
Net income: US$80.8m (down 16% from 2Q 2022).
Profit margin: 16% (down from 19% in 2Q 2022). The decrease in margin was driven by higher expenses.
EPS: US$1.10 (down from US$1.30 in 2Q 2022).
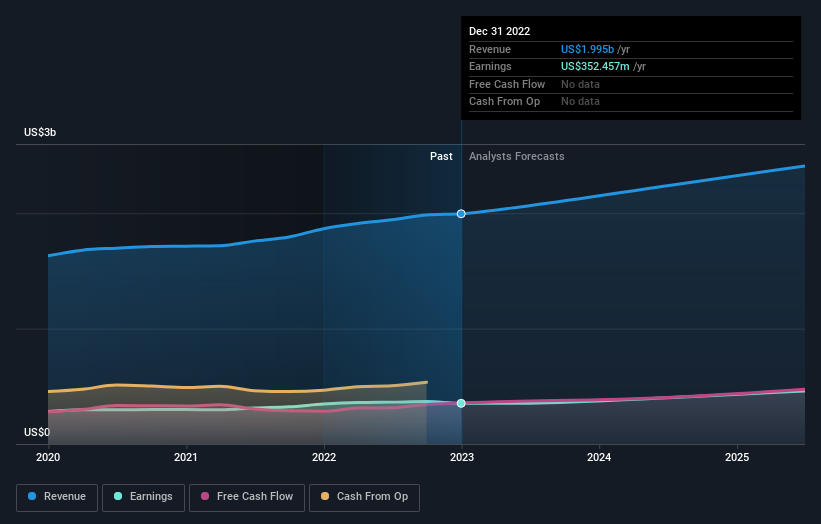
All figures shown in the chart above are for the trailing 12 month (TTM) period
Jack Henry & Associates Revenues and Earnings Miss Expectations
Revenue missed analyst estimates by 2.0%. Earnings per share (EPS) also missed analyst estimates by 1.3%.
Looking ahead, revenue is forecast to grow 7.6% p.a. on average during the next 3 years, compared to a 10% growth forecast for the IT industry in the US.
Performance of the American IT industry.
The company's shares are down 9.8% from a week ago.
Risk Analysis
What about risks? Every company has them, and we've spotted 1 warning sign for Jack Henry & Associates you should know about.
Have feedback on this article? Concerned about the content? Get in touch with us directly. Alternatively, email editorial-team (at) simplywallst.com.
This article by Simply Wall St is general in nature. We provide commentary based on historical data and analyst forecasts only using an unbiased methodology and our articles are not intended to be financial advice. It does not constitute a recommendation to buy or sell any stock, and does not take account of your objectives, or your financial situation. We aim to bring you long-term focused analysis driven by fundamental data. Note that our analysis may not factor in the latest price-sensitive company announcements or qualitative material. Simply Wall St has no position in any stocks mentioned.
Join A Paid User Research Session
You’ll receive a US$30 Amazon Gift card for 1 hour of your time while helping us build better investing tools for the individual investors like yourself. Sign up here
