
 Yahoo Finance
 Johns Lyng Group (ASX:JLG) shareholders have earned a 85% CAGR over the last three years
For us, stock picking is in large part the hunt for the truly magnificent stocks. Mistakes are inevitable, but a single top stock pick can cover any losses, and so much more. One bright shining star stock has been Johns Lyng Group Limited (ASX:JLG), which is 503% higher than three years ago. Also pleasing for shareholders was the 14% gain in the last three months. We love happy stories like this one. The company should be really proud of that performance!
So let's assess the underlying fundamentals over the last 3 years and see if they've moved in lock-step with shareholder returns.
See our latest analysis for Johns Lyng Group
To quote Buffett, 'Ships will sail around the world but the Flat Earth Society will flourish. There will continue to be wide discrepancies between price and value in the marketplace...' One way to examine how market sentiment has changed over time is to look at the interaction between a company's share price and its earnings per share (EPS).
Johns Lyng Group was able to grow its EPS at 15% per year over three years, sending the share price higher. This EPS growth is lower than the 82% average annual increase in the share price. So it's fair to assume the market has a higher opinion of the business than it did three years ago. That's not necessarily surprising considering the three-year track record of earnings growth. This favorable sentiment is reflected in its (fairly optimistic) P/E ratio of 109.12.
You can see below how EPS has changed over time (discover the exact values by clicking on the image).
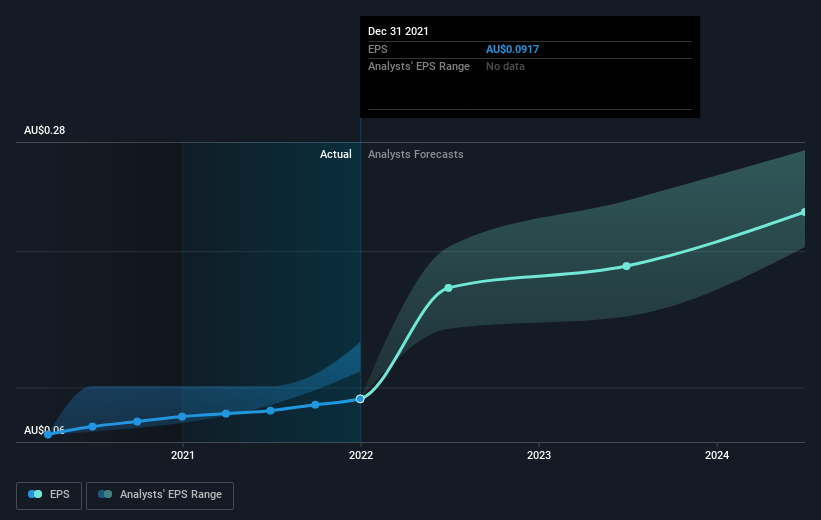
It's probably worth noting we've seen significant insider buying in the last quarter, which we consider a positive. That said, we think earnings and revenue growth trends are even more important factors to consider. It might be well worthwhile taking a look at our free report on Johns Lyng Group's earnings, revenue and cash flow.
What About Dividends?
As well as measuring the share price return, investors should also consider the total shareholder return (TSR). The TSR is a return calculation that accounts for the value of cash dividends (assuming that any dividend received was reinvested) and the calculated value of any discounted capital raisings and spin-offs. So for companies that pay a generous dividend, the TSR is often a lot higher than the share price return. We note that for Johns Lyng Group the TSR over the last 3 years was 533%, which is better than the share price return mentioned above. The dividends paid by the company have thusly boosted the total shareholder return.
A Different Perspective
We're pleased to report that Johns Lyng Group rewarded shareholders with a total shareholder return of 111% over the last year. That's including the dividend. So this year's TSR was actually better than the three-year TSR (annualized) of 85%. The improving returns to shareholders suggests the stock is becoming more popular with time. While it is well worth considering the different impacts that market conditions can have on the share price, there are other factors that are even more important. Take risks, for example - Johns Lyng Group has 1 warning sign we think you should be aware of.
There are plenty of other companies that have insiders buying up shares. You probably do not want to miss this free list of growing companies that insiders are buying.
Please note, the market returns quoted in this article reflect the market weighted average returns of stocks that currently trade on AU exchanges.
Have feedback on this article? Concerned about the content? Get in touch with us directly. Alternatively, email editorial-team (at) simplywallst.com.
This article by Simply Wall St is general in nature. We provide commentary based on historical data and analyst forecasts only using an unbiased methodology and our articles are not intended to be financial advice. It does not constitute a recommendation to buy or sell any stock, and does not take account of your objectives, or your financial situation. We aim to bring you long-term focused analysis driven by fundamental data. Note that our analysis may not factor in the latest price-sensitive company announcements or qualitative material. Simply Wall St has no position in any stocks mentioned.
