
 Yahoo Finance
 Kering SA's Dividend Analysis
An In-Depth Look at Kering SA's Upcoming Dividend and Its Sustainability
Kering SA (PPRUY) recently announced a dividend of $1.01 per share, payable on 2024-05-21, with the ex-dividend date set for 2024-04-30. As investors look forward to this upcoming payment, the spotlight also shines on the company's dividend history, yield, and growth rates. Using the data from GuruFocus, let's look into Kering SA's dividend performance and assess its sustainability.
What Does Kering SA Do?
This Powerful Chart Made Peter Lynch 29% A Year For 13 Years
How to calculate the intrinsic value of a stock?
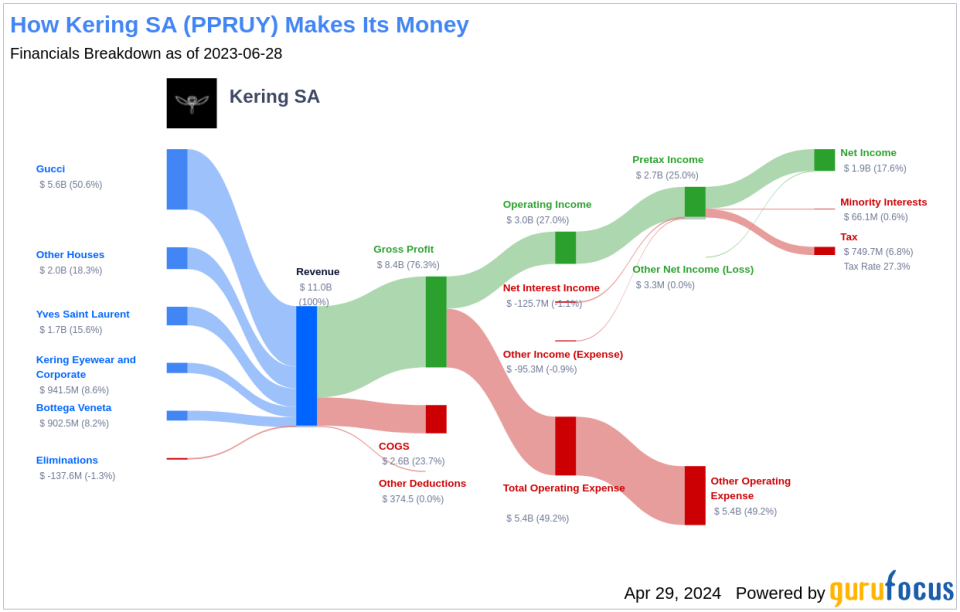
Kering is the world's second-largest luxury goods conglomerate after LVMH. Its flagship brand is Gucci, which accounts for over 50% of revenue and almost 70% of operating profits. Its other leading brands include Bottega Veneta and Saint Laurent. Other smaller luxury brands (in ready-to-wear, leather goods, and jewellery) generate 19% of sales. Alexander McQueen, Balenciaga, and Boucheron are part of Kering's portfolio.
A Glimpse at Kering SA's Dividend History
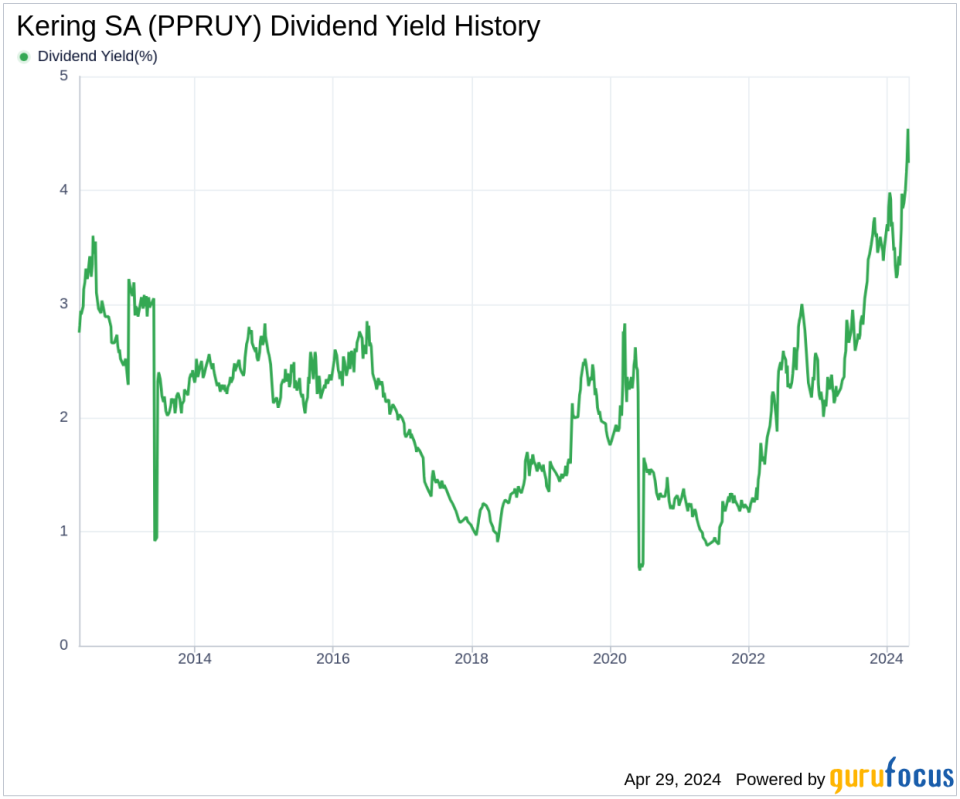
Kering SA has maintained a consistent dividend payment record since 2012. Dividends are currently distributed on a bi-annual basis. Below is a chart showing annual Dividends Per Share for tracking historical trends.
Breaking Down Kering SA's Dividend Yield and Growth
As of today, Kering SA currently has a 12-month trailing dividend yield of 4.24% and a 12-month forward dividend yield of 4.14%. This suggests an expectation of decreased dividend payments over the next 12 months. Kering SA's dividend yield of 4.24% is near a 10-year high and outperforms 70.71% of global competitors in the Retail - Cyclical industry, suggesting that the company's dividend yield stands out as an attractive proposition for income investors.
Over the past three years, Kering SA's annual dividend growth rate was 20.50%. Extended to a five-year horizon, this rate decreased to 14.20% per year. And over the past decade, Kering SA's annual dividends per share growth rate stands at an impressive 15.20%.
Based on Kering SA's dividend yield and five-year growth rate, the 5-year yield on cost of Kering SA stock as of today is approximately 8.24%.
The Sustainability Question: Payout Ratio and Profitability
To assess the sustainability of the dividend, one needs to evaluate the company's payout ratio. The dividend payout ratio provides insights into the portion of earnings the company distributes as dividends. A lower ratio suggests that the company retains a significant part of its earnings, thereby ensuring the availability of funds for future growth and unexpected downturns. As of 2023-12-31, Kering SA's dividend payout ratio is 0.55.
Kering SA's profitability rank, offers an understanding of the company's earnings prowess relative to its peers. GuruFocus ranks Kering SA's profitability 9 out of 10 as of 2023-12-31, suggesting good profitability prospects. The company has reported positive net income for each of year over the past decade, further solidifying its high profitability.
Growth Metrics: The Future Outlook
To ensure the sustainability of dividends, a company must have robust growth metrics. Kering SA's growth rank of 9 out of 10 suggests that the company's growth trajectory is good relative to its competitors.
Revenue is the lifeblood of any company, and Kering SA's revenue per share, combined with the 3-year revenue growth rate, indicates a strong revenue model. Kering SA's revenue has increased by approximately 15.10% per year on average, a rate that outperforms approximately 73.73% of global competitors.
The company's 3-year EPS growth rate showcases its capability to grow its earnings, a critical component for sustaining dividends in the long run. During the past three years, Kering SA's earnings increased by approximately 16.60% per year on average, a rate that outperforms approximately 56.8% of global competitors.
Lastly, the company's 5-year EBITDA growth rate of 4.90%, which outperforms approximately 39.61% of global competitors.
Next Steps
In conclusion, Kering SA's upcoming dividend payment, coupled with its history of consistent dividend growth, reflects the company's commitment to shareholder returns. The robust dividend yield, especially when seen in the context of the company's payout ratio and profitability rank, suggests that these dividends are sustainable. Moreover, Kering SA's strong growth metrics bode well for the future, potentially ensuring the continuation of its dividend payments. Investors considering Kering SA for its dividend prospects should also take note of the company's overall financial health and growth prospects, which GuruFocus thoroughly analyzes. For those seeking similar investment opportunities, GuruFocus Premium users can screen for high-dividend yield stocks using the High Dividend Yield Screener.
This article, generated by GuruFocus, is designed to provide general insights and is not tailored financial advice. Our commentary is rooted in historical data and analyst projections, utilizing an impartial methodology, and is not intended to serve as specific investment guidance. It does not formulate a recommendation to purchase or divest any stock and does not consider individual investment objectives or financial circumstances. Our objective is to deliver long-term, fundamental data-driven analysis. Be aware that our analysis might not incorporate the most recent, price-sensitive company announcements or qualitative information. GuruFocus holds no position in the stocks mentioned herein.
This article first appeared on GuruFocus.
