
 Yahoo Finance
 Do You Know What ACCO Brands Corporation’s (NYSE:ACCO) P/E Ratio Means?

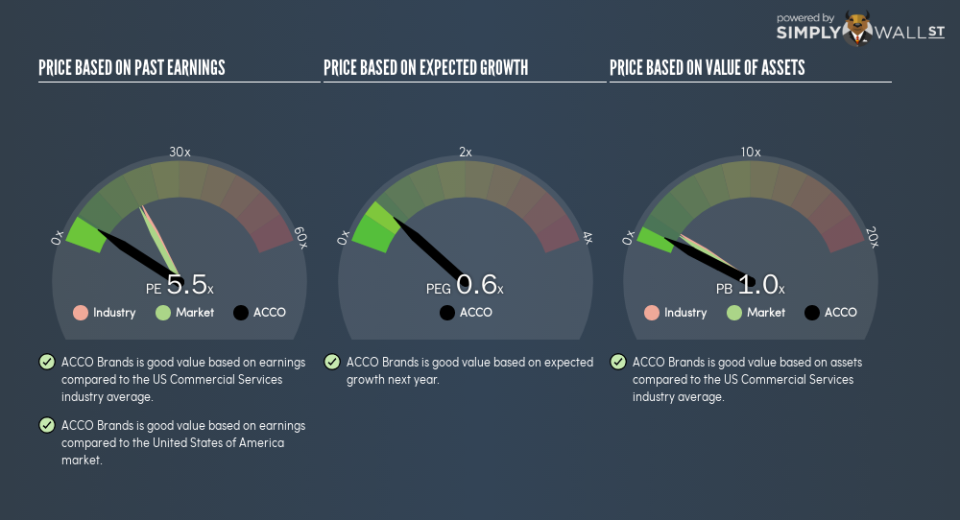
This article is written for those who want to get better at using price to earnings ratios (P/E ratios). We’ll show how you can use ACCO Brands Corporation’s (NYSE:ACCO) P/E ratio to inform your assessment of the investment opportunity. ACCO Brands has a P/E ratio of 5.46, based on the last twelve months. That means that at current prices, buyers pay $5.46 for every $1 in trailing yearly profits.
View our latest analysis for ACCO Brands
How Do I Calculate A Price To Earnings Ratio?
The formula for price to earnings is:
Price to Earnings Ratio = Share Price ÷ Earnings per Share (EPS)
Or for ACCO Brands:
P/E of 5.46 = $7.52 ÷ $1.38 (Based on the year to September 2018.)
Is A High P/E Ratio Good?
A higher P/E ratio means that investors are paying a higher price for each $1 of company earnings. That is not a good or a bad thing per se, but a high P/E does imply buyers are optimistic about the future.
How Growth Rates Impact P/E Ratios
P/E ratios primarily reflect market expectations around earnings growth rates. That’s because companies that grow earnings per share quickly will rapidly increase the ‘E’ in the equation. Therefore, even if you pay a high multiple of earnings now, that multiple will become lower in the future. Then, a lower P/E should attract more buyers, pushing the share price up.
It’s nice to see that ACCO Brands grew EPS by a stonking 134% in the last year. And its annual EPS growth rate over 5 years is 14%. I’d therefore be a little surprised if its P/E ratio was not relatively high.
How Does ACCO Brands’s P/E Ratio Compare To Its Peers?
The P/E ratio essentially measures market expectations of a company. We can see in the image below that the average P/E (18.5) for companies in the commercial services industry is higher than ACCO Brands’s P/E.
ACCO Brands’s P/E tells us that market participants think it will not fare as well as its peers in the same industry. Many investors like to buy stocks when the market is pessimistic about their prospects. It is arguably worth checking if insiders are buying shares, because that might imply they believe the stock is undervalued.
Remember: P/E Ratios Don’t Consider The Balance Sheet
Don’t forget that the P/E ratio considers market capitalization. That means it doesn’t take debt or cash into account. In theory, a company can lower its future P/E ratio by using cash or debt to invest in growth.
Such expenditure might be good or bad, in the long term, but the point here is that the balance sheet is not reflected by this ratio.
ACCO Brands’s Balance Sheet
ACCO Brands’s net debt is considerable, at 111% of its market cap. If you want to compare its P/E ratio to other companies, you must keep in mind that these debt levels would usually warrant a relatively low P/E.
The Bottom Line On ACCO Brands’s P/E Ratio
ACCO Brands trades on a P/E ratio of 5.5, which is below the US market average of 17.5. The company has a meaningful amount of debt on the balance sheet, but that should not eclipse the solid earnings growth. If it continues to grow, then the current low P/E may prove to be unjustified.
Investors should be looking to buy stocks that the market is wrong about. As value investor Benjamin Graham famously said, ‘In the short run, the market is a voting machine but in the long run, it is a weighing machine.’ So this free report on the analyst consensus forecasts could help you make a master move on this stock.
You might be able to find a better buy than ACCO Brands. If you want a selection of possible winners, check out this free list of interesting companies that trade on a P/E below 20 (but have proven they can grow earnings).
To help readers see past the short term volatility of the financial market, we aim to bring you a long-term focused research analysis purely driven by fundamental data. Note that our analysis does not factor in the latest price-sensitive company announcements.
The author is an independent contributor and at the time of publication had no position in the stocks mentioned. For errors that warrant correction please contact the editor at editorial-team@simplywallst.com.
