
 Yahoo Finance
 What You Should Know About Regenbogen AG's (FRA:RGB) Financial Strength

Want to participate in a short research study? Help shape the future of investing tools and you could win a $250 gift card!
Investors are always looking for growth in small-cap stocks like Regenbogen AG (FRA:RGB), with a market cap of €20m. However, an important fact which most ignore is: how financially healthy is the business? Assessing first and foremost the financial health is essential, since poor capital management may bring about bankruptcies, which occur at a higher rate for small-caps. The following basic checks can help you get a picture of the company's balance sheet strength. Nevertheless, these checks don't give you a full picture, so I suggest you dig deeper yourself into RGB here.
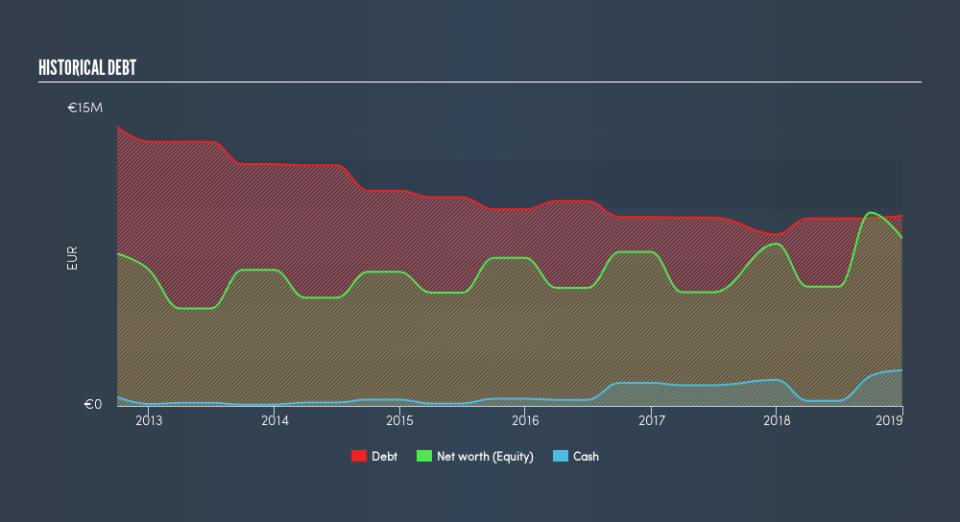
RGB’s Debt (And Cash Flows)
Over the past year, RGB has ramped up its debt from €8.7m to €9.6m , which accounts for long term debt. With this rise in debt, RGB's cash and short-term investments stands at €1.8m , ready to be used for running the business. On top of this, RGB has produced €2.0m in operating cash flow in the last twelve months, leading to an operating cash to total debt ratio of 20%, signalling that RGB’s operating cash is sufficient to cover its debt.
Can RGB pay its short-term liabilities?
Looking at RGB’s €6.4m in current liabilities, it appears that the company arguably has a rather low level of current assets relative its obligations, with the current ratio last standing at 0.45x. The current ratio is calculated by dividing current assets by current liabilities.
Can RGB service its debt comfortably?
With total debt exceeding equity, RGB is considered a highly levered company. This is somewhat unusual for small-caps companies, since lenders are often hesitant to provide attractive interest rates to less-established businesses. No matter how high the company’s debt, if it can easily cover the interest payments, it’s considered to be efficient with its use of excess leverage. A company generating earnings before interest and tax (EBIT) at least three times its net interest payments is considered financially sound. In RGB's case, the ratio of 1.58x suggests that interest is not strongly covered, which means that lenders may be more reluctant to lend out more funding as RGB’s low interest coverage already puts the company at higher risk of default.
Next Steps:
Although RGB’s debt level is towards the higher end of the spectrum, its cash flow coverage seems adequate to meet debt obligations which means its debt is being efficiently utilised. However, its low liquidity raises concerns over whether current asset management practices are properly implemented for the small-cap. I admit this is a fairly basic analysis for RGB's financial health. Other important fundamentals need to be considered alongside. You should continue to research Regenbogen to get a better picture of the stock by looking at:
Future Outlook: What are well-informed industry analysts predicting for RGB’s future growth? Take a look at our free research report of analyst consensus for RGB’s outlook.
Valuation: What is RGB worth today? Is the stock undervalued, even when its growth outlook is factored into its intrinsic value? The intrinsic value infographic in our free research report helps visualize whether RGB is currently mispriced by the market.
Other High-Performing Stocks: Are there other stocks that provide better prospects with proven track records? Explore our free list of these great stocks here.
We aim to bring you long-term focused research analysis driven by fundamental data. Note that our analysis may not factor in the latest price-sensitive company announcements or qualitative material.
If you spot an error that warrants correction, please contact the editor at editorial-team@simplywallst.com. This article by Simply Wall St is general in nature. It does not constitute a recommendation to buy or sell any stock, and does not take account of your objectives, or your financial situation. Simply Wall St has no position in the stocks mentioned. Thank you for reading.
