
 Yahoo Finance
 Laboratory Corporation of America Holdings' (NYSE:LH) three-year earnings growth trails the stellar shareholder returns
The most you can lose on any stock (assuming you don't use leverage) is 100% of your money. But when you pick a company that is really flourishing, you can make more than 100%. For instance the Laboratory Corporation of America Holdings (NYSE:LH) share price is 102% higher than it was three years ago. Most would be happy with that. And in the last week the share price has popped 5.0%. But this could be related to the buoyant market which is up about 3.7% in a week.
Since the stock has added US$975m to its market cap in the past week alone, let's see if underlying performance has been driving long-term returns.
See our latest analysis for Laboratory Corporation of America Holdings
To paraphrase Benjamin Graham: Over the short term the market is a voting machine, but over the long term it's a weighing machine. One way to examine how market sentiment has changed over time is to look at the interaction between a company's share price and its earnings per share (EPS).
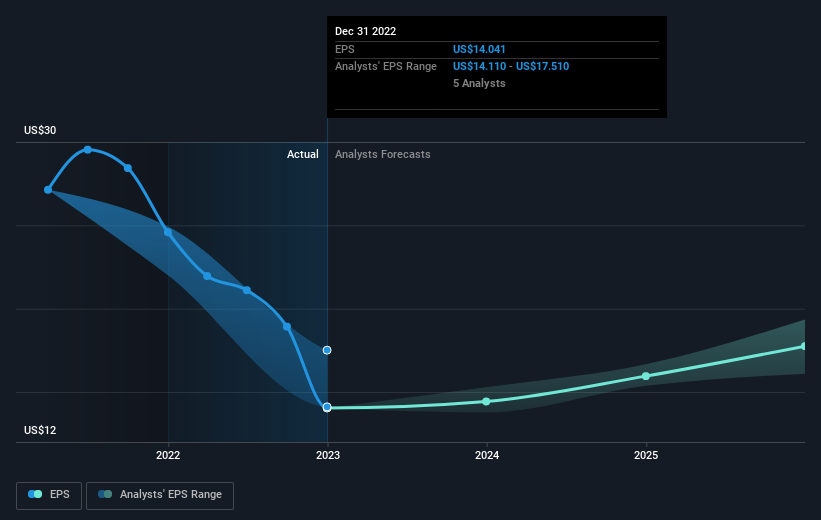
During three years of share price growth, Laboratory Corporation of America Holdings achieved compound earnings per share growth of 20% per year. This EPS growth is lower than the 27% average annual increase in the share price. This suggests that, as the business progressed over the last few years, it gained the confidence of market participants. It is quite common to see investors become enamoured with a business, after a few years of solid progress.
The graphic below depicts how EPS has changed over time (unveil the exact values by clicking on the image).
Dive deeper into Laboratory Corporation of America Holdings' key metrics by checking this interactive graph of Laboratory Corporation of America Holdings's earnings, revenue and cash flow.
What About Dividends?
When looking at investment returns, it is important to consider the difference between total shareholder return (TSR) and share price return. Whereas the share price return only reflects the change in the share price, the TSR includes the value of dividends (assuming they were reinvested) and the benefit of any discounted capital raising or spin-off. So for companies that pay a generous dividend, the TSR is often a lot higher than the share price return. We note that for Laboratory Corporation of America Holdings the TSR over the last 3 years was 105%, which is better than the share price return mentioned above. This is largely a result of its dividend payments!
A Different Perspective
We regret to report that Laboratory Corporation of America Holdings shareholders are down 12% for the year (even including dividends). Unfortunately, that's worse than the broader market decline of 11%. Having said that, it's inevitable that some stocks will be oversold in a falling market. The key is to keep your eyes on the fundamental developments. Longer term investors wouldn't be so upset, since they would have made 8%, each year, over five years. If the fundamental data continues to indicate long term sustainable growth, the current sell-off could be an opportunity worth considering. I find it very interesting to look at share price over the long term as a proxy for business performance. But to truly gain insight, we need to consider other information, too. For instance, we've identified 3 warning signs for Laboratory Corporation of America Holdings that you should be aware of.
If you like to buy stocks alongside management, then you might just love this free list of companies. (Hint: insiders have been buying them).
Please note, the market returns quoted in this article reflect the market weighted average returns of stocks that currently trade on American exchanges.
Have feedback on this article? Concerned about the content? Get in touch with us directly. Alternatively, email editorial-team (at) simplywallst.com.
This article by Simply Wall St is general in nature. We provide commentary based on historical data and analyst forecasts only using an unbiased methodology and our articles are not intended to be financial advice. It does not constitute a recommendation to buy or sell any stock, and does not take account of your objectives, or your financial situation. We aim to bring you long-term focused analysis driven by fundamental data. Note that our analysis may not factor in the latest price-sensitive company announcements or qualitative material. Simply Wall St has no position in any stocks mentioned.
Join A Paid User Research Session
You’ll receive a US$30 Amazon Gift card for 1 hour of your time while helping us build better investing tools for the individual investors like yourself. Sign up here
