
 Yahoo Finance
 Liquidity Services (NASDAQ:LQDT) Is Experiencing Growth In Returns On Capital
If we want to find a stock that could multiply over the long term, what are the underlying trends we should look for? Ideally, a business will show two trends; firstly a growing return on capital employed (ROCE) and secondly, an increasing amount of capital employed. Put simply, these types of businesses are compounding machines, meaning they are continually reinvesting their earnings at ever-higher rates of return. Speaking of which, we noticed some great changes in Liquidity Services' (NASDAQ:LQDT) returns on capital, so let's have a look.
Understanding Return On Capital Employed (ROCE)
For those who don't know, ROCE is a measure of a company's yearly pre-tax profit (its return), relative to the capital employed in the business. To calculate this metric for Liquidity Services, this is the formula:
Return on Capital Employed = Earnings Before Interest and Tax (EBIT) ÷ (Total Assets - Current Liabilities)
0.15 = US$25m ÷ (US$304m - US$133m) (Based on the trailing twelve months to March 2024).
So, Liquidity Services has an ROCE of 15%. In absolute terms, that's a satisfactory return, but compared to the Commercial Services industry average of 9.9% it's much better.
Check out our latest analysis for Liquidity Services
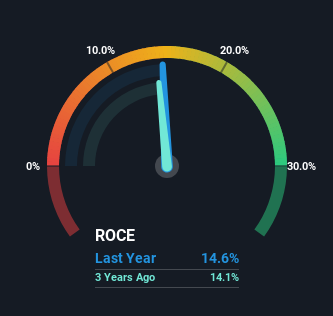
Above you can see how the current ROCE for Liquidity Services compares to its prior returns on capital, but there's only so much you can tell from the past. If you'd like to see what analysts are forecasting going forward, you should check out our free analyst report for Liquidity Services .
What Can We Tell From Liquidity Services' ROCE Trend?
Liquidity Services has recently broken into profitability so their prior investments seem to be paying off. About five years ago the company was generating losses but things have turned around because it's now earning 15% on its capital. Not only that, but the company is utilizing 32% more capital than before, but that's to be expected from a company trying to break into profitability. This can tell us that the company has plenty of reinvestment opportunities that are able to generate higher returns.
For the record though, there was a noticeable increase in the company's current liabilities over the period, so we would attribute some of the ROCE growth to that. The current liabilities has increased to 44% of total assets, so the business is now more funded by the likes of its suppliers or short-term creditors. Given it's pretty high ratio, we'd remind investors that having current liabilities at those levels can bring about some risks in certain businesses.
Our Take On Liquidity Services' ROCE
Overall, Liquidity Services gets a big tick from us thanks in most part to the fact that it is now profitable and is reinvesting in its business. And a remarkable 226% total return over the last five years tells us that investors are expecting more good things to come in the future. Therefore, we think it would be worth your time to check if these trends are going to continue.
If you want to continue researching Liquidity Services, you might be interested to know about the 1 warning sign that our analysis has discovered.
While Liquidity Services isn't earning the highest return, check out this free list of companies that are earning high returns on equity with solid balance sheets.
Have feedback on this article? Concerned about the content? Get in touch with us directly. Alternatively, email editorial-team (at) simplywallst.com.
This article by Simply Wall St is general in nature. We provide commentary based on historical data and analyst forecasts only using an unbiased methodology and our articles are not intended to be financial advice. It does not constitute a recommendation to buy or sell any stock, and does not take account of your objectives, or your financial situation. We aim to bring you long-term focused analysis driven by fundamental data. Note that our analysis may not factor in the latest price-sensitive company announcements or qualitative material. Simply Wall St has no position in any stocks mentioned.
