
 Yahoo Finance
 A Look At The Fair Value Of Vista Group International Limited (NZSE:VGL)

In this article we are going to estimate the intrinsic value of Vista Group International Limited (NZSE:VGL) by taking the expected future cash flows and discounting them to today's value. One way to achieve this is by employing the Discounted Cash Flow (DCF) model. It may sound complicated, but actually it is quite simple!
Companies can be valued in a lot of ways, so we would point out that a DCF is not perfect for every situation. For those who are keen learners of equity analysis, the Simply Wall St analysis model here may be something of interest to you.
Check out our latest analysis for Vista Group International
Step by step through the calculation
We use what is known as a 2-stage model, which simply means we have two different periods of growth rates for the company's cash flows. Generally the first stage is higher growth, and the second stage is a lower growth phase. To start off with, we need to estimate the next ten years of cash flows. Seeing as no analyst estimates of free cash flow are available to us, we have extrapolate the previous free cash flow (FCF) from the company's last reported value. We assume companies with shrinking free cash flow will slow their rate of shrinkage, and that companies with growing free cash flow will see their growth rate slow, over this period. We do this to reflect that growth tends to slow more in the early years than it does in later years.
A DCF is all about the idea that a dollar in the future is less valuable than a dollar today, so we need to discount the sum of these future cash flows to arrive at a present value estimate:
10-year free cash flow (FCF) estimate
2021 | 2022 | 2023 | 2024 | 2025 | 2026 | 2027 | 2028 | 2029 | 2030 | |
Levered FCF (NZ$, Millions) | NZ$15.7m | NZ$18.3m | NZ$20.6m | NZ$22.6m | NZ$24.3m | NZ$25.7m | NZ$27.0m | NZ$28.2m | NZ$29.2m | NZ$30.2m |
Growth Rate Estimate Source | Est @ 22.78% | Est @ 16.73% | Est @ 12.49% | Est @ 9.52% | Est @ 7.45% | Est @ 5.99% | Est @ 4.97% | Est @ 4.26% | Est @ 3.76% | Est @ 3.41% |
Present Value (NZ$, Millions) Discounted @ 8.7% | NZ$14.5 | NZ$15.5 | NZ$16.1 | NZ$16.2 | NZ$16.0 | NZ$15.6 | NZ$15.1 | NZ$14.5 | NZ$13.8 | NZ$13.2 |
("Est" = FCF growth rate estimated by Simply Wall St)
Present Value of 10-year Cash Flow (PVCF) = NZ$150m
We now need to calculate the Terminal Value, which accounts for all the future cash flows after this ten year period. The Gordon Growth formula is used to calculate Terminal Value at a future annual growth rate equal to the 5-year average of the 10-year government bond yield of 2.6%. We discount the terminal cash flows to today's value at a cost of equity of 8.7%.
Terminal Value (TV)= FCF2030 × (1 + g) ÷ (r – g) = NZ$30m× (1 + 2.6%) ÷ (8.7%– 2.6%) = NZ$512m
Present Value of Terminal Value (PVTV)= TV / (1 + r)10= NZ$512m÷ ( 1 + 8.7%)10= NZ$223m
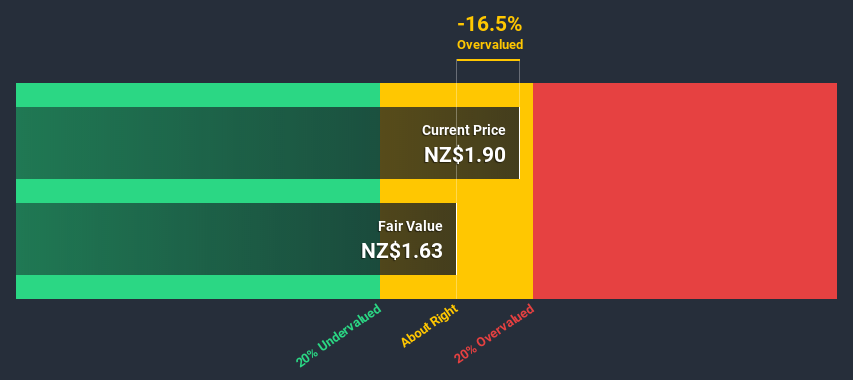
The total value is the sum of cash flows for the next ten years plus the discounted terminal value, which results in the Total Equity Value, which in this case is NZ$373m. The last step is to then divide the equity value by the number of shares outstanding. Relative to the current share price of NZ$1.9, the company appears around fair value at the time of writing. Remember though, that this is just an approximate valuation, and like any complex formula - garbage in, garbage out.
The assumptions
The calculation above is very dependent on two assumptions. The first is the discount rate and the other is the cash flows. If you don't agree with these result, have a go at the calculation yourself and play with the assumptions. The DCF also does not consider the possible cyclicality of an industry, or a company's future capital requirements, so it does not give a full picture of a company's potential performance. Given that we are looking at Vista Group International as potential shareholders, the cost of equity is used as the discount rate, rather than the cost of capital (or weighted average cost of capital, WACC) which accounts for debt. In this calculation we've used 8.7%, which is based on a levered beta of 1.009. Beta is a measure of a stock's volatility, compared to the market as a whole. We get our beta from the industry average beta of globally comparable companies, with an imposed limit between 0.8 and 2.0, which is a reasonable range for a stable business.
Next Steps:
Although the valuation of a company is important, it ideally won't be the sole piece of analysis you scrutinize for a company. It's not possible to obtain a foolproof valuation with a DCF model. Rather it should be seen as a guide to "what assumptions need to be true for this stock to be under/overvalued?" For instance, if the terminal value growth rate is adjusted slightly, it can dramatically alter the overall result. For Vista Group International, there are three further aspects you should look at:
Risks: You should be aware of the 2 warning signs for Vista Group International we've uncovered before considering an investment in the company.
Future Earnings: How does VGL's growth rate compare to its peers and the wider market? Dig deeper into the analyst consensus number for the upcoming years by interacting with our free analyst growth expectation chart.
Other High Quality Alternatives: Do you like a good all-rounder? Explore our interactive list of high quality stocks to get an idea of what else is out there you may be missing!
PS. The Simply Wall St app conducts a discounted cash flow valuation for every stock on the NZSE every day. If you want to find the calculation for other stocks just search here.
This article by Simply Wall St is general in nature. It does not constitute a recommendation to buy or sell any stock, and does not take account of your objectives, or your financial situation. We aim to bring you long-term focused analysis driven by fundamental data. Note that our analysis may not factor in the latest price-sensitive company announcements or qualitative material. Simply Wall St has no position in any stocks mentioned.
Have feedback on this article? Concerned about the content? Get in touch with us directly. Alternatively, email editorial-team@simplywallst.com.
