
 Yahoo Finance
 Loss-making Sunrun (NASDAQ:RUN) sheds a further US$104m, taking total shareholder losses to 71% over 3 years
As an investor, mistakes are inevitable. But you want to avoid the really big losses like the plague. So consider, for a moment, the misfortune of Sunrun Inc. (NASDAQ:RUN) investors who have held the stock for three years as it declined a whopping 71%. That would be a disturbing experience. And over the last year the share price fell 31%, so we doubt many shareholders are delighted. Furthermore, it's down 24% in about a quarter. That's not much fun for holders. We note that the company has reported results fairly recently; and the market is hardly delighted. You can check out the latest numbers in our company report.
With the stock having lost 3.9% in the past week, it's worth taking a look at business performance and seeing if there's any red flags.
Check out our latest analysis for Sunrun
Given that Sunrun didn't make a profit in the last twelve months, we'll focus on revenue growth to form a quick view of its business development. Shareholders of unprofitable companies usually desire strong revenue growth. That's because fast revenue growth can be easily extrapolated to forecast profits, often of considerable size.
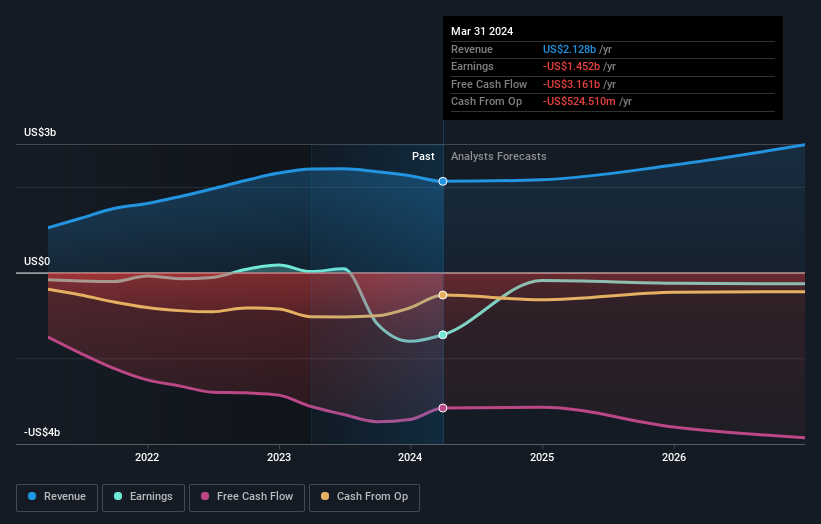
In the last three years, Sunrun saw its revenue grow by 22% per year, compound. That is faster than most pre-profit companies. So why has the share priced crashed 20% per year, in the same time? You'd want to take a close look at the balance sheet, as well as the losses. Ultimately, revenue growth doesn't amount to much if the business can't scale well. Unless the balance sheet is strong, the company might have to raise capital.
You can see below how earnings and revenue have changed over time (discover the exact values by clicking on the image).
Sunrun is a well known stock, with plenty of analyst coverage, suggesting some visibility into future growth. Given we have quite a good number of analyst forecasts, it might be well worth checking out this free chart depicting consensus estimates.
A Different Perspective
Sunrun shareholders are down 31% for the year, but the market itself is up 28%. However, keep in mind that even the best stocks will sometimes underperform the market over a twelve month period. Regrettably, last year's performance caps off a bad run, with the shareholders facing a total loss of 5% per year over five years. Generally speaking long term share price weakness can be a bad sign, though contrarian investors might want to research the stock in hope of a turnaround. I find it very interesting to look at share price over the long term as a proxy for business performance. But to truly gain insight, we need to consider other information, too. Even so, be aware that Sunrun is showing 5 warning signs in our investment analysis , and 1 of those is potentially serious...
If you like to buy stocks alongside management, then you might just love this free list of companies. (Hint: insiders have been buying them).
Please note, the market returns quoted in this article reflect the market weighted average returns of stocks that currently trade on American exchanges.
Have feedback on this article? Concerned about the content? Get in touch with us directly. Alternatively, email editorial-team (at) simplywallst.com.
This article by Simply Wall St is general in nature. We provide commentary based on historical data and analyst forecasts only using an unbiased methodology and our articles are not intended to be financial advice. It does not constitute a recommendation to buy or sell any stock, and does not take account of your objectives, or your financial situation. We aim to bring you long-term focused analysis driven by fundamental data. Note that our analysis may not factor in the latest price-sensitive company announcements or qualitative material. Simply Wall St has no position in any stocks mentioned.
