
 Yahoo Finance
 The Magic Software Enterprises (NASDAQ:MGIC) Share Price Is Up 42% And Shareholders Are Holding On

Want to participate in a short research study? Help shape the future of investing tools and you could win a $250 gift card!
Vanguard founder Jack Bogle helped spearhead the low-cost index fund, putting average returns within reach of every investor. But you can make superior returns by picking better-than average stocks. To wit, Magic Software Enterprises Ltd. (NASDAQ:MGIC) shares are up 42% in three years, besting the market return. Zooming in, the stock is up a respectable 18% in the last year.
View our latest analysis for Magic Software Enterprises
To paraphrase Benjamin Graham: Over the short term the market is a voting machine, but over the long term it's a weighing machine. By comparing earnings per share (EPS) and share price changes over time, we can get a feel for how investor attitudes to a company have morphed over time.
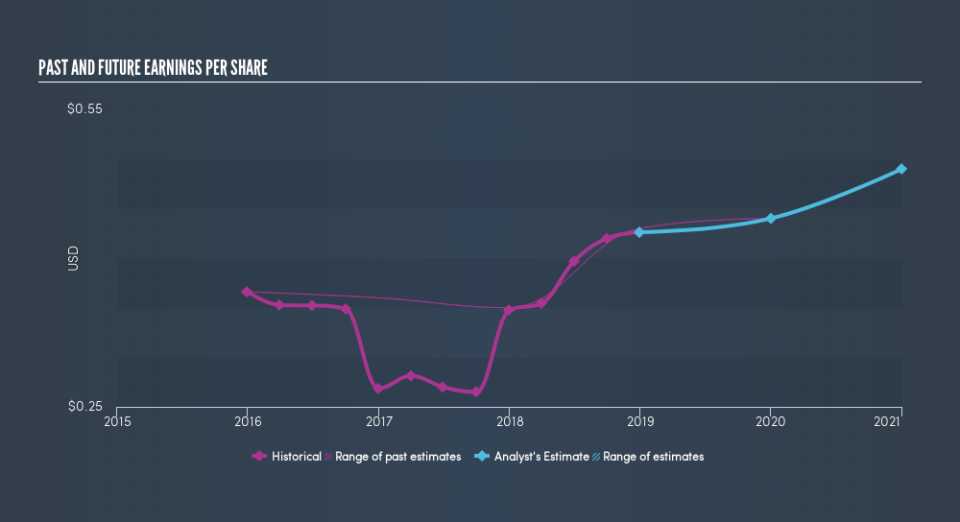
Magic Software Enterprises was able to grow its EPS at 5.2% per year over three years, sending the share price higher. This EPS growth is lower than the 13% average annual increase in the share price. This indicates that the market is feeling more optimistic on the stock, after the last few years of progress. It is quite common to see investors become enamoured with a business, after a few years of solid progress.
You can see how EPS has changed over time in the image below (click on the chart to see the exact values).
We know that Magic Software Enterprises has improved its bottom line lately, but is it going to grow revenue? Check if analysts think Magic Software Enterprises will grow revenue in the future.
What About Dividends?
It is important to consider the total shareholder return, as well as the share price return, for any given stock. The TSR is a return calculation that accounts for the value of cash dividends (assuming that any dividend received was reinvested) and the calculated value of any discounted capital raisings and spin-offs. It's fair to say that the TSR gives a more complete picture for stocks that pay a dividend. We note that for Magic Software Enterprises the TSR over the last 3 years was 56%, which is better than the share price return mentioned above. The dividends paid by the company have thusly boosted the total shareholder return.
A Different Perspective
It's nice to see that Magic Software Enterprises shareholders have received a total shareholder return of 22% over the last year. And that does include the dividend. That's better than the annualised return of 6.1% over half a decade, implying that the company is doing better recently. In the best case scenario, this may hint at some real business momentum, implying that now could be a great time to delve deeper. Importantly, we haven't analysed Magic Software Enterprises's dividend history. This free visual report on its dividends is a must-read if you're thinking of buying.
But note: Magic Software Enterprises may not be the best stock to buy. So take a peek at this free list of interesting companies with past earnings growth (and further growth forecast).
Please note, the market returns quoted in this article reflect the market weighted average returns of stocks that currently trade on US exchanges.
We aim to bring you long-term focused research analysis driven by fundamental data. Note that our analysis may not factor in the latest price-sensitive company announcements or qualitative material.
If you spot an error that warrants correction, please contact the editor at editorial-team@simplywallst.com. This article by Simply Wall St is general in nature. It does not constitute a recommendation to buy or sell any stock, and does not take account of your objectives, or your financial situation. Simply Wall St has no position in the stocks mentioned. Thank you for reading.
