
 Yahoo Finance
 Many Would Be Envious Of Spark New Zealand's (NZSE:SPK) Excellent Returns On Capital
If you're not sure where to start when looking for the next multi-bagger, there are a few key trends you should keep an eye out for. Ideally, a business will show two trends; firstly a growing return on capital employed (ROCE) and secondly, an increasing amount of capital employed. This shows us that it's a compounding machine, able to continually reinvest its earnings back into the business and generate higher returns. That's why when we briefly looked at Spark New Zealand's (NZSE:SPK) ROCE trend, we were very happy with what we saw.
What is Return On Capital Employed (ROCE)?
Just to clarify if you're unsure, ROCE is a metric for evaluating how much pre-tax income (in percentage terms) a company earns on the capital invested in its business. Analysts use this formula to calculate it for Spark New Zealand:
Return on Capital Employed = Earnings Before Interest and Tax (EBIT) ÷ (Total Assets - Current Liabilities)
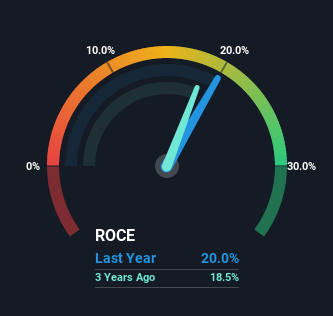
0.20 = NZ$648m ÷ (NZ$4.2b - NZ$910m) (Based on the trailing twelve months to December 2021).
Thus, Spark New Zealand has an ROCE of 20%. That's a fantastic return and not only that, it outpaces the average of 3.9% earned by companies in a similar industry.
View our latest analysis for Spark New Zealand
In the above chart we have measured Spark New Zealand's prior ROCE against its prior performance, but the future is arguably more important. If you're interested, you can view the analysts predictions in our free report on analyst forecasts for the company.
The Trend Of ROCE
We'd be pretty happy with returns on capital like Spark New Zealand. Over the past five years, ROCE has remained relatively flat at around 20% and the business has deployed 21% more capital into its operations. With returns that high, it's great that the business can continually reinvest its money at such appealing rates of return. If these trends can continue, it wouldn't surprise us if the company became a multi-bagger.
The Bottom Line On Spark New Zealand's ROCE
In summary, we're delighted to see that Spark New Zealand has been compounding returns by reinvesting at consistently high rates of return, as these are common traits of a multi-bagger. Therefore it's no surprise that shareholders have earned a respectable 76% return if they held over the last five years. So while investors seem to be recognizing these promising trends, we still believe the stock deserves further research.
If you want to continue researching Spark New Zealand, you might be interested to know about the 2 warning signs that our analysis has discovered.
High returns are a key ingredient to strong performance, so check out our free list ofstocks earning high returns on equity with solid balance sheets.
Have feedback on this article? Concerned about the content? Get in touch with us directly. Alternatively, email editorial-team (at) simplywallst.com.
This article by Simply Wall St is general in nature. We provide commentary based on historical data and analyst forecasts only using an unbiased methodology and our articles are not intended to be financial advice. It does not constitute a recommendation to buy or sell any stock, and does not take account of your objectives, or your financial situation. We aim to bring you long-term focused analysis driven by fundamental data. Note that our analysis may not factor in the latest price-sensitive company announcements or qualitative material. Simply Wall St has no position in any stocks mentioned.
