
 Yahoo Finance
 March Madness hits the equity markets

David Nelson, CFA, is the Chief Strategist of Belpointe Asset Management
March Madness went well beyond the basketball court this season, hitting equity markets forcing some investors to the side lines. The roller coaster ride on and off the courts kept investors on edge wondering if the market would fold like the No. 1 seed Virginia. For the moment, it looks like a successful retest of the February lows, stopping once again at the all-important 200-day moving average. Like most retests our confidence won’t be restored until we’ve put some distance between us and volatile first quarter.
Volatility returns
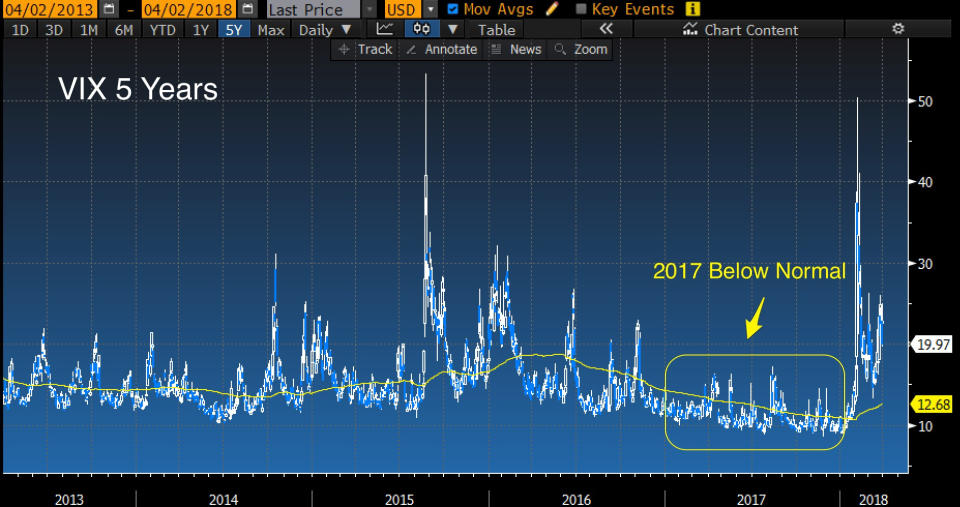
After a 2017 with little volatility, an elevated VIX is pretty uncomfortable. However, when put in the perspective of a five-year chart it seems pretty normal. Executive action sparking fears of a trade war followed by a meltdown in Big Cap Tech on the heels of a Facebook (FB) data scandal and you had a pretty toxic cocktail for investors to swallow. Trade war angst seems overdone especially in light of the fact the administration has already moved closer to center with active negotiations, the norm rather than the exception. As for the concern surrounding Big Cap Tech and privacy, that’s likely to be with us for some time or at least until we can get a better read as to just how much business models may or may not be forced to change.
The first negative quarter since September 2015 has investors on edge questioning their resolve so let’s put this in some perspective. Let’s look at some long-term charts to see if we’ve really blown away the bull trend started eight years earlier.
Long-term trend
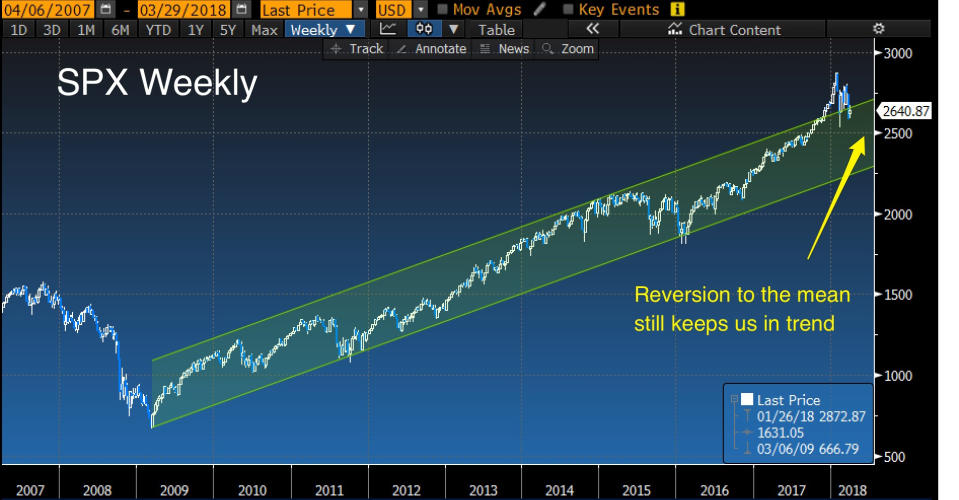
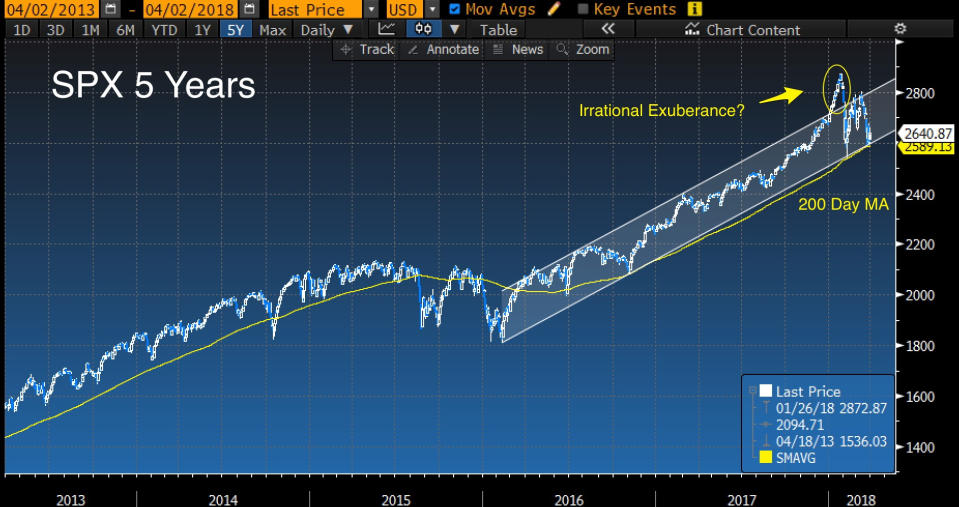
The long trend is intact but January clearly blew out the top of the range inviting a reversion to the mean. Markets could trend sideways for a couple of months and still be within that long-term trend. For the moment even the Bull Run off the 2016 lows has held but there isn’t a lot of margin before we get a breach.
Irrational exuberance?
Biggest risk for the market
IMHO the biggest risk for the market is a policy mistake by the Federal Reserve. I’ve warned often about the flattening yield curve which on its present course has the potential of inverting if the Fed maintains an aggressive pace of normalization. In the last year, short rates are up 125 basis points while 30-year yields have actually declined. The need for the Fed to normalize is well understood with little ammunition in to battle the next downturn.

However, this is the end of a very long experiment abnormal in every sense and requires a little patience. Admittedly, the Fed is late to the party but shouldn’t make up for that by raising rates at every meeting. Take a breath and give markets an opportunity to absorb the event. The wealth effect driven by strong equity markets is a big part of the recovery. While a flat or inverted curve doesn’t guarantee a recession, let’s not give it the opportunity to become a self-fulfilling prophecy.
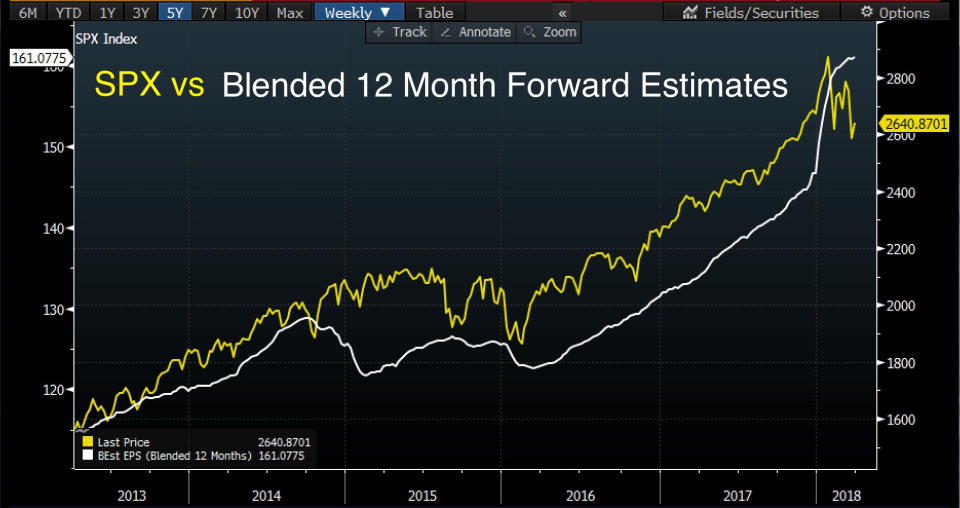
In the end, stocks follow earnings and at least for now little has changed in that picture. Earnings projections are still on I-95 North and until proven otherwise stocks will likely remain in a positive trend. To be sure there are some excesses. Tech valuations are pushing the envelope and the sector is now close to 25% of the overall index. If Facebook and other Big Cap Tech companies face increased regulations as a result of user demands for government intervention, than business models are at risk along with valuations.
U.S. almost always ranks poorly on valuation and for good reason
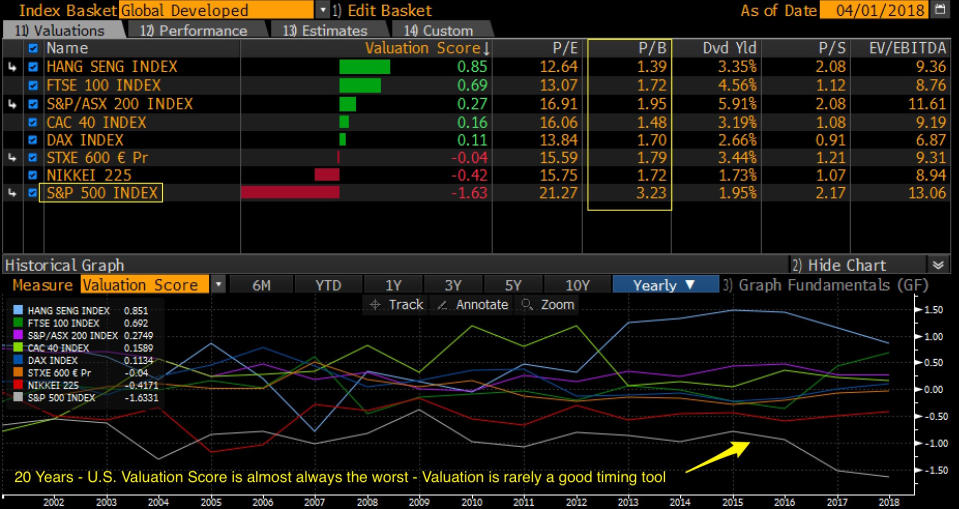
Another challenge for the market often brought up by asset allocators is U.S. valuations in comparison to the rest of the world. Yes, U.S. valuations are rich when compared to the Hang Seng, Europe or most of the developed world. It’s been that way for as long as I can remember. Traditional valuation measures like Price/Book have always made the U.S. expensive on a relative basis but when you factor in the rule of law, our dominance in key areas of technology not to mention a current trend to roll back regulations why wouldn’t it be more expensive.
All in, there are challenges for equity investors and price often leads fundamentals. Current price momentum warrants concern but it’s not time for the Captain to order “abandon ship.”
