
 Yahoo Finance
 Market Cool On Enprise Group Limited's (NZSE:ENS) Revenues
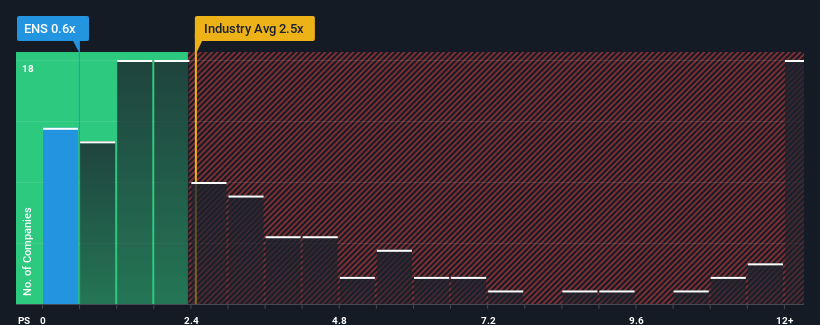
Enprise Group Limited's (NZSE:ENS) price-to-sales (or "P/S") ratio of 0.6x might make it look like a buy right now compared to the Software industry in New Zealand, where around half of the companies have P/S ratios above 2.4x and even P/S above 5x are quite common. However, the P/S might be low for a reason and it requires further investigation to determine if it's justified.
See our latest analysis for Enprise Group
How Has Enprise Group Performed Recently?
The revenue growth achieved at Enprise Group over the last year would be more than acceptable for most companies. One possibility is that the P/S is low because investors think this respectable revenue growth might actually underperform the broader industry in the near future. If that doesn't eventuate, then existing shareholders have reason to be optimistic about the future direction of the share price.
Want the full picture on earnings, revenue and cash flow for the company? Then our free report on Enprise Group will help you shine a light on its historical performance.
Do Revenue Forecasts Match The Low P/S Ratio?
In order to justify its P/S ratio, Enprise Group would need to produce sluggish growth that's trailing the industry.
If we review the last year of revenue growth, the company posted a worthy increase of 11%. This was backed up an excellent period prior to see revenue up by 109% in total over the last three years. So we can start by confirming that the company has done a great job of growing revenues over that time.
This is in contrast to the rest of the industry, which is expected to grow by 23% over the next year, materially lower than the company's recent medium-term annualised growth rates.
In light of this, it's peculiar that Enprise Group's P/S sits below the majority of other companies. It looks like most investors are not convinced the company can maintain its recent growth rates.
The Bottom Line On Enprise Group's P/S
We'd say the price-to-sales ratio's power isn't primarily as a valuation instrument but rather to gauge current investor sentiment and future expectations.
Our examination of Enprise Group revealed its three-year revenue trends aren't boosting its P/S anywhere near as much as we would have predicted, given they look better than current industry expectations. When we see strong revenue with faster-than-industry growth, we assume there are some significant underlying risks to the company's ability to make money which is applying downwards pressure on the P/S ratio. While recent revenue trends over the past medium-term suggest that the risk of a price decline is low, investors appear to perceive a likelihood of revenue fluctuations in the future.
There are also other vital risk factors to consider and we've discovered 5 warning signs for Enprise Group (4 don't sit too well with us!) that you should be aware of before investing here.
If companies with solid past earnings growth is up your alley, you may wish to see this free collection of other companies with strong earnings growth and low P/E ratios.
Have feedback on this article? Concerned about the content? Get in touch with us directly. Alternatively, email editorial-team (at) simplywallst.com.
This article by Simply Wall St is general in nature. We provide commentary based on historical data and analyst forecasts only using an unbiased methodology and our articles are not intended to be financial advice. It does not constitute a recommendation to buy or sell any stock, and does not take account of your objectives, or your financial situation. We aim to bring you long-term focused analysis driven by fundamental data. Note that our analysis may not factor in the latest price-sensitive company announcements or qualitative material. Simply Wall St has no position in any stocks mentioned.
