
 Yahoo Finance
 The Market Doesn't Like What It Sees From Pacific Edge Limited's (NZSE:PEB) Revenues Yet As Shares Tumble 32%
To the annoyance of some shareholders, Pacific Edge Limited (NZSE:PEB) shares are down a considerable 32% in the last month, which continues a horrid run for the company. For any long-term shareholders, the last month ends a year to forget by locking in a 85% share price decline.
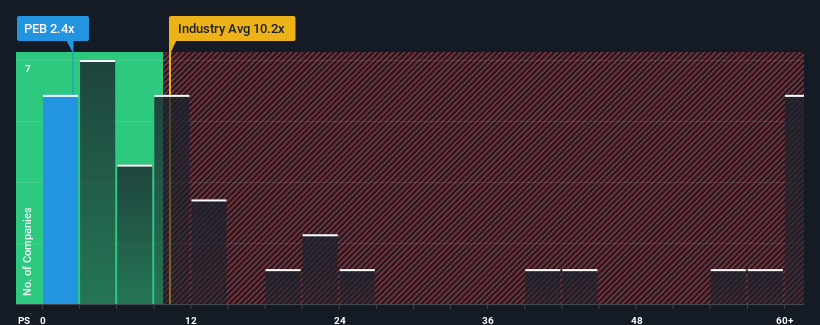
Following the heavy fall in price, Pacific Edge's price-to-sales (or "P/S") ratio of 2.4x might make it look like a strong buy right now compared to the wider Biotechs industry in New Zealand, where around half of the companies have P/S ratios above 10.2x and even P/S above 26x are quite common. Although, it's not wise to just take the P/S at face value as there may be an explanation why it's so limited.
Check out our latest analysis for Pacific Edge
What Does Pacific Edge's P/S Mean For Shareholders?
Pacific Edge's revenue growth of late has been pretty similar to most other companies. One possibility is that the P/S ratio is low because investors think this modest revenue performance may begin to slide. If you like the company, you'd be hoping this isn't the case so that you could pick up some stock while it's out of favour.
If you'd like to see what analysts are forecasting going forward, you should check out our free report on Pacific Edge.
What Are Revenue Growth Metrics Telling Us About The Low P/S?
There's an inherent assumption that a company should far underperform the industry for P/S ratios like Pacific Edge's to be considered reasonable.
Taking a look back first, we see that the company grew revenue by an impressive 55% last year. The latest three year period has also seen an incredible overall rise in revenue, aided by its incredible short-term performance. Accordingly, shareholders would have been over the moon with those medium-term rates of revenue growth.
Looking ahead now, revenue is anticipated to climb by 43% during the coming year according to the three analysts following the company. That's shaping up to be materially lower than the 337% growth forecast for the broader industry.
With this information, we can see why Pacific Edge is trading at a P/S lower than the industry. It seems most investors are expecting to see limited future growth and are only willing to pay a reduced amount for the stock.
The Final Word
Shares in Pacific Edge have plummeted and its P/S has followed suit. Typically, we'd caution against reading too much into price-to-sales ratios when settling on investment decisions, though it can reveal plenty about what other market participants think about the company.
As we suspected, our examination of Pacific Edge's analyst forecasts revealed that its inferior revenue outlook is contributing to its low P/S. Shareholders' pessimism on the revenue prospects for the company seems to be the main contributor to the depressed P/S. Unless these conditions improve, they will continue to form a barrier for the share price around these levels.
We don't want to rain on the parade too much, but we did also find 3 warning signs for Pacific Edge (1 shouldn't be ignored!) that you need to be mindful of.
If companies with solid past earnings growth is up your alley, you may wish to see this free collection of other companies with strong earnings growth and low P/E ratios.
Have feedback on this article? Concerned about the content? Get in touch with us directly. Alternatively, email editorial-team (at) simplywallst.com.
This article by Simply Wall St is general in nature. We provide commentary based on historical data and analyst forecasts only using an unbiased methodology and our articles are not intended to be financial advice. It does not constitute a recommendation to buy or sell any stock, and does not take account of your objectives, or your financial situation. We aim to bring you long-term focused analysis driven by fundamental data. Note that our analysis may not factor in the latest price-sensitive company announcements or qualitative material. Simply Wall St has no position in any stocks mentioned.
