
 Yahoo Finance
 The Market Lifts Fibon Berhad (KLSE:FIBON) Shares 30% But It Can Do More
Fibon Berhad (KLSE:FIBON) shareholders have had their patience rewarded with a 30% share price jump in the last month. The last 30 days bring the annual gain to a very sharp 26%.
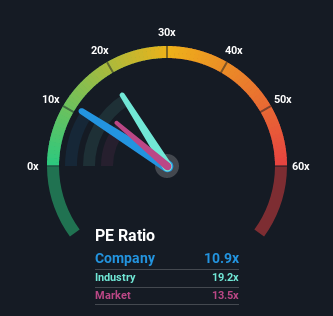
In spite of the firm bounce in price, Fibon Berhad may still be sending bullish signals at the moment with its price-to-earnings (or "P/E") ratio of 10.9x, since almost half of all companies in Malaysia have P/E ratios greater than 14x and even P/E's higher than 25x are not unusual. Although, it's not wise to just take the P/E at face value as there may be an explanation why it's limited.
With earnings growth that's exceedingly strong of late, Fibon Berhad has been doing very well. One possibility is that the P/E is low because investors think this strong earnings growth might actually underperform the broader market in the near future. If you like the company, you'd be hoping this isn't the case so that you could potentially pick up some stock while it's out of favour.
Check out our latest analysis for Fibon Berhad
Although there are no analyst estimates available for Fibon Berhad, take a look at this free data-rich visualisation to see how the company stacks up on earnings, revenue and cash flow.
Is There Any Growth For Fibon Berhad?
The only time you'd be truly comfortable seeing a P/E as low as Fibon Berhad's is when the company's growth is on track to lag the market.
If we review the last year of earnings growth, the company posted a terrific increase of 123%. Pleasingly, EPS has also lifted 65% in aggregate from three years ago, thanks to the last 12 months of growth. So we can start by confirming that the company has done a great job of growing earnings over that time.
Comparing that to the market, which is only predicted to deliver 9.2% growth in the next 12 months, the company's momentum is stronger based on recent medium-term annualised earnings results.
With this information, we find it odd that Fibon Berhad is trading at a P/E lower than the market. Apparently some shareholders believe the recent performance has exceeded its limits and have been accepting significantly lower selling prices.
The Key Takeaway
Despite Fibon Berhad's shares building up a head of steam, its P/E still lags most other companies. Generally, our preference is to limit the use of the price-to-earnings ratio to establishing what the market thinks about the overall health of a company.
Our examination of Fibon Berhad revealed its three-year earnings trends aren't contributing to its P/E anywhere near as much as we would have predicted, given they look better than current market expectations. There could be some major unobserved threats to earnings preventing the P/E ratio from matching this positive performance. At least price risks look to be very low if recent medium-term earnings trends continue, but investors seem to think future earnings could see a lot of volatility.
There are also other vital risk factors to consider and we've discovered 4 warning signs for Fibon Berhad (1 shouldn't be ignored!) that you should be aware of before investing here.
It's important to make sure you look for a great company, not just the first idea you come across. So take a peek at this free list of interesting companies with strong recent earnings growth (and a P/E ratio below 20x).
Have feedback on this article? Concerned about the content? Get in touch with us directly. Alternatively, email editorial-team (at) simplywallst.com.
This article by Simply Wall St is general in nature. We provide commentary based on historical data and analyst forecasts only using an unbiased methodology and our articles are not intended to be financial advice. It does not constitute a recommendation to buy or sell any stock, and does not take account of your objectives, or your financial situation. We aim to bring you long-term focused analysis driven by fundamental data. Note that our analysis may not factor in the latest price-sensitive company announcements or qualitative material. Simply Wall St has no position in any stocks mentioned.
Join A Paid User Research Session
You’ll receive a US$30 Amazon Gift card for 1 hour of your time while helping us build better investing tools for the individual investors like yourself. Sign up here
