
 Yahoo Finance
 Matterport Announces Second Quarter 2022 Financial Results, with Stronger-than-Expected Subscription Revenue and Non-GAAP EPS
Matterport Q2 2022 Infographic
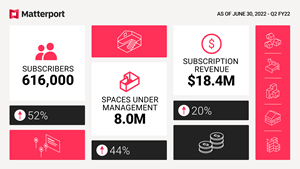
Subscription revenue rose 20% year-over-year, above Company guidance
Services revenue increased 74% year-over-year
Q2 GAAP loss per share of $0.23
Non-GAAP loss per share of $0.12, better than Company guidance
Matterport increases full year revenue guidance range to $132 to $138 million, narrows full year guidance range for non-GAAP loss per share to $0.46 to $0.50
Balance sheet remains strong with $562 million cash and investments and no debt
SUNNYVALE, Calif., Aug. 10, 2022 (GLOBE NEWSWIRE) -- Matterport, Inc. (Nasdaq: MTTR) (“Matterport” or the “Company”), the leading spatial data company driving the digital transformation of the built world, today announced financial results for the quarter ended June 30, 2022.
“We delivered another strong quarter, increasing our subscriber count by 52% to 616,000 subscribers. We expanded Spaces Under Management by 44% to over 8 million spaces,” said RJ Pittman, Chairman and Chief Executive Officer of Matterport. “We continue to see strength in our enterprise subscriber base, and believe that customers who adopt digital twins will realize increased revenues and lower their operating costs, gaining a powerful advantage in any economic environment. Our laser focus on delivering measurable customer value for large enterprises and small businesses alike is fueling our growth and scaling our platform. Our recent acquisition of VHT Studios extends our offering to satisfy the growing demand for digital twins and integrated marketing solutions for the residential, commercial and hospitality real estate industries,” Pittman added.
“We are pleased to report subscription revenue of $18.4 million for the quarter, above the high end of our guidance range. We continued to improve operating efficiencies and reported non-GAAP loss per share of $0.12 for the quarter, also better than our guidance range,” said JD Fay, Chief Financial Officer of Matterport. “Quarterly subscription revenue increased by 20% year-over-year and continues to grow as a proportion of total revenue, comprising 65% of total revenue, up from 60% in the first quarter of 2022. These are strong results that demonstrate our ability to drive the business forward and lead through the macro environment effectively. With $562 million of cash and short- and long-term investments, we believe we have the financial strength to comfortably achieve our long term business plan.”
Second Quarter 2022 Financial Highlights
Spaces Under Management (SUM) grew to 8.0 million, up 10% compared to the first quarter of 2022
Total subscribers increased to 616,000, up 10% sequentially
Subscription revenue was $18.4 million, up 7% sequentially
Total revenue was $28.5 million, flat sequentially
Annualized Recurring Revenue (ARR) exiting the second quarter was $73.6 million
Exited Q2 with record product backlog
Recent Business Highlights
Acquired VHT Studios to accelerate adoption of digital twins for real estate. The combination of VHT Studios’ visual media technology and services with the immersive Matterport 3D Digital Twin platform is expected to elevate the buying and leasing experience while simplifying the process of creating comprehensive marketing packages for enterprise brokerages and agents
Partnered with CGS, a global provider of applications, enterprise learning, and outsourcing services, to deliver virtual training solutions for front-line workers across the Fortune 500
Completed SOC 2 Type II standards for confidentiality, a key requirement for many Fortune 500 customers and other enterprise organizations evaluating the deployment of digital twins
Donated digital twin technology to SBP, formerly known as the St. Bernard Project, to help disaster-affected communities accelerate the FEMA appeals process
Appointed Susan Repo to the board of directors and to serve as chair of the audit committee. Ms. Repo is the Chief Financial Officer of ICEYE and also serves on the board of directors of Mitek Systems, Inc. (Nasdaq: MITK) and GM Financial Bank
Full Year and Third Quarter 2022 Outlook
| Q3 2022 | FY 2022 |
Revenue (in millions) | $35 — $37 | $132 — $138 |
Subscription Revenue (in millions) | $18.5 — $18.8 | $73 — $74 |
Non-GAAP loss per share | ($0.13) - ($0.15) | ($0.46) - ($0.50) |
Weighted average fully diluted shares outstanding (in millions) | 288 | 286 |
Non-GAAP Financial Information
Matterport has provided in this press release financial information that has not been prepared in accordance with generally accepted accounting principles in the United States (GAAP). We believe that the presentation of non-GAAP financial information provides important supplemental information to management and investors regarding financial and business trends relating to Matterport’s financial condition and results of operations.
The presentation of these non-GAAP financial measures are not meant to be considered in isolation or as a substitute for comparable GAAP financial measures and should be read only in conjunction with the Company’s consolidated financial statements prepared in accordance with GAAP. For further information regarding these non-GAAP measures, including the reconciliation of these non-GAAP financial measures to their most directly comparable GAAP financial measures, please refer to the financial tables below.
Non-GAAP Net Loss and Non-GAAP Net Loss Per Share, Basic and Diluted. Matterport defines non-GAAP net loss as net income (loss), adjusted to exclude stock-based compensation expense, fair value change of warrants liabilities, fair value change of earn-out liabilities, payroll tax related to contingent earn-out share issuance, acquisition transaction costs, and amortization of acquired intangible assets, in order to provide investors and management with greater visibility to the underlying performance of Matterport’s recurring core business operations. In order to calculate non-GAAP net loss per share, basic and diluted, Matterport uses a non-GAAP weighted-average share count. Matterport defines non-GAAP weighted-average shares used to compute non-GAAP net loss per share, basic and diluted, as GAAP weighted average shares used to compute net income (loss) per share attributable to common stockholders, basic, adjusted to reflect the shares of Matterport’s Class A common stock exchanged for the previously issued and outstanding shares of redeemable convertible preferred stock and common stock warrants of Matterport, Inc. (now known as Matterport Operating, LLC) in connection with the recently completed merger, that are outstanding as of the end of the period as if they were outstanding as of the beginning of the period for comparability, and the potentially dilutive effect of the Company’s employee equity incentive plan awards.
Conference Call Information
Matterport will host a conference call for analysts and investors to discuss its financial results for the second quarter of fiscal 2022 today at 1:30 p.m. Pacific time (4:30 p.m. Eastern time). A recorded webcast of the event will also be available following the call for one year on the Matterport’s Investor Relations website at investors.matterport.com.
About Matterport
Matterport, Inc. (Nasdaq: MTTR) is leading the digital transformation of the built world. Our groundbreaking spatial data platform turns buildings into data to make nearly every space more valuable and accessible. Millions of buildings in more than 177 countries have been transformed into immersive Matterport digital twins to improve every part of the building lifecycle from planning, construction, and operations to documentation, appraisal and marketing. Learn more at matterport.com and browse a gallery of digital twins.
©2022 Matterport, Inc. All rights reserved. Matterport is a registered trademark and the Matterport logo is a trademark of Matterport, Inc. All other marks are the property of their respective owners.
Forward-Looking Statements
This press release contains certain forward-looking statements within the meaning of the federal securities laws, including statements regarding the services offered by Matterport, Inc. and the markets in which Matterport operates, business strategies, debt levels, industry environment including relating to the global supply chain, potential growth opportunities, the effects of regulations and Matterport’s projected future results. These forward-looking statements generally are identified by the words “believe,” “project,” “expect,” “anticipate,” “estimate,” “intend,” “strategy,” “future,” “forecast,” “opportunity,” “plan,” “may,” “should,” “will,” “would,” “will be,” “will continue,” “will likely result,” and similar expressions (including the negative versions of such words or expressions).
Forward-looking statements are predictions, projections and other statements about future events that are based on current expectations and assumptions and, as a result, are subject to risks and uncertainties. Many factors could cause actual future events to differ materially from the forward-looking statements in this document, including Matterport’s ability to implement business plans, forecasts, and other expectations in the industry in which Matterport competes, and identify and realize additional opportunities. The foregoing list of factors is not exhaustive. You should carefully consider the foregoing factors and the other risks and uncertainties described in documents filed by Matterport from time to time with the U.S. Securities and Exchange Commission. These filings identify and address other important risks and uncertainties that could cause actual events and results to differ materially from those contained in the forward-looking statements. Forward-looking statements speak only as of the date they are made. Readers are cautioned not to put undue reliance on forward-looking statements, and Matterport assumes no obligation and, except as required by law, does not intend to update or revise these forward-looking statements, whether as a result of new information, future events, or otherwise. Matterport does not give any assurance that it will achieve its expectations.
Investor Contact:
Soohwan Kim, CFA
VP, Investor Relations
ir@matterport.com
Media Contact:
Toru Levinson
press@matterport.com
MATTERPORT, INC.
CONDENSED CONSOLIDATED STATEMENTS OF OPERATIONS
(In thousands, except per share data)
(Unaudited)
| Three Months Ended June 30, |
| Six Months Ended June 30, | ||||||||||||
|
| 2022 |
|
|
| 2021 |
|
|
| 2022 |
|
|
| 2021 |
|
Revenue: |
|
|
|
|
|
|
| ||||||||
Subscription | $ | 18,386 |
|
| $ | 15,281 |
|
| $ | 35,527 |
|
| $ | 29,081 |
|
License |
| 26 |
|
|
| 2,099 |
|
|
| 49 |
|
|
| 4,359 |
|
Services |
| 5,013 |
|
|
| 2,879 |
|
|
| 8,986 |
|
|
| 5,568 |
|
Product |
| 5,056 |
|
|
| 9,244 |
|
|
| 12,429 |
|
|
| 17,424 |
|
Total revenue |
| 28,481 |
|
|
| 29,503 |
|
|
| 56,991 |
|
|
| 56,432 |
|
Costs of revenue: |
|
|
|
|
|
|
| ||||||||
Subscription |
| 6,109 |
|
|
| 3,384 |
|
|
| 11,371 |
|
|
| 6,635 |
|
License |
| — |
|
|
| — |
|
|
| — |
|
|
| — |
|
Services |
| 3,169 |
|
|
| 2,290 |
|
|
| 6,152 |
|
|
| 4,325 |
|
Product |
| 7,490 |
|
|
| 6,015 |
|
|
| 15,846 |
|
|
| 10,930 |
|
Total costs of revenue |
| 16,768 |
|
|
| 11,689 |
|
|
| 33,369 |
|
|
| 21,890 |
|
Gross profit |
| 11,713 |
|
|
| 17,814 |
|
|
| 23,622 |
|
|
| 34,542 |
|
Operating expenses: |
|
|
|
|
|
|
| ||||||||
Research and development |
| 21,518 |
|
|
| 7,090 |
|
|
| 47,520 |
|
|
| 13,115 |
|
Selling, general, and administrative |
| 59,385 |
|
|
| 16,501 |
|
|
| 130,234 |
|
|
| 29,559 |
|
Total operating expenses |
| 80,903 |
|
|
| 23,591 |
|
|
| 177,754 |
|
|
| 42,674 |
|
Loss from operations |
| (69,190 | ) |
|
| (5,777 | ) |
|
| (154,132 | ) |
|
| (8,132 | ) |
Other income (expense): |
|
|
|
|
|
|
| ||||||||
Interest income |
| 1,484 |
|
|
| 14 |
|
|
| 2,779 |
|
|
| 22 |
|
Interest expense |
| — |
|
|
| (277 | ) |
|
| — |
|
|
| (585 | ) |
Change in fair value of warrants liabilities |
| 4,714 |
|
|
| — |
|
|
| 26,147 |
|
|
| — |
|
Change in fair value of contingent earn-out liability |
| — |
|
|
| — |
|
|
| 136,043 |
|
|
| — |
|
Other expense, net |
| (1,353 | ) |
|
| (149 | ) |
|
| (2,674 | ) |
|
| (347 | ) |
Total other income (expense) |
| 4,845 |
|
|
| (412 | ) |
|
| 162,295 |
|
|
| (910 | ) |
Income (loss) before provision for income taxes |
| (64,345 | ) |
|
| (6,189 | ) |
|
| 8,163 |
|
|
| (9,042 | ) |
Provision for income taxes |
| 289 |
|
|
| 20 |
|
|
| 893 |
|
|
| 39 |
|
Net income (loss) | $ | (64,634 | ) |
| $ | (6,209 | ) |
| $ | 7,270 |
|
| $ | (9,081 | ) |
Net income (loss) per share attributable to common stockholders: |
|
|
|
|
|
|
| ||||||||
Basic | $ | (0.23 | ) |
| $ | (0.15 | ) |
| $ | 0.03 |
|
| $ | (0.22 | ) |
Diluted | $ | (0.23 | ) |
| $ | (0.15 | ) |
| $ | 0.02 |
|
| $ | (0.22 | ) |
Weighted-average shares used in computing net income (loss) per share attributable to common stockholders: |
|
|
|
|
|
|
| ||||||||
Basic |
| 283,405 |
|
|
| 41,348 |
|
|
| 279,289 |
|
|
| 40,490 |
|
Diluted |
| 283,405 |
|
|
| 41,348 |
|
|
| 313,834 |
|
|
| 40,490 |
|
MATTERPORT INC.
CONDENSED CONSOLIDATED BALANCE SHEETS
(In thousands)
(Unaudited)
| June 30, |
| December 31, | ||||
|
| 2022 |
|
|
| 2021 |
|
ASSETS |
|
|
| ||||
Current assets: |
|
|
| ||||
Cash and cash equivalents | $ | 113,923 |
|
| $ | 139,519 |
|
Restricted cash |
| — |
|
|
| 468 |
|
Short-term investments |
| 362,300 |
|
|
| 264,931 |
|
Accounts receivable, net |
| 14,521 |
|
|
| 10,879 |
|
Inventories |
| 6,475 |
|
|
| 5,593 |
|
Prepaid expenses and other current assets |
| 15,377 |
|
|
| 16,313 |
|
Total current assets |
| 512,596 |
|
|
| 437,703 |
|
Property and equipment, net |
| 25,750 |
|
|
| 14,118 |
|
Operating lease right-of-use assets |
| 3,087 |
|
|
| — |
|
Long-term investments |
| 85,842 |
|
|
| 263,659 |
|
Goodwill |
| 54,080 |
|
|
| — |
|
Intangible assets, net |
| 4,875 |
|
|
| — |
|
Other assets |
| 3,302 |
|
|
| 3,696 |
|
Total assets | $ | 689,532 |
|
| $ | 719,176 |
|
LIABILITIES AND STOCKHOLDERS’ EQUITY |
|
|
| ||||
Current liabilities |
|
|
| ||||
Accounts payable | $ | 14,685 |
|
| $ | 12,227 |
|
Deferred revenue |
| 14,302 |
|
|
| 11,074 |
|
Accrued expenses and other current liabilities |
| 21,228 |
|
|
| 10,026 |
|
Total current liabilities |
| 50,215 |
|
|
| 33,327 |
|
Warrants liability |
| 1,691 |
|
|
| 38,974 |
|
Contingent earn-out liability |
| — |
|
|
| 377,576 |
|
Deferred revenue, non-current |
| 288 |
|
|
| 874 |
|
Other long-term liabilities |
| 6,131 |
|
|
| 262 |
|
Total liabilities |
| 58,325 |
|
|
| 451,013 |
|
Stockholders’ equity: |
|
|
| ||||
Common stock | $ | 28 |
|
| $ | 25 |
|
Additional paid-in capital |
| 1,099,617 |
|
|
| 737,735 |
|
Accumulated other comprehensive loss |
| (7,650 | ) |
|
| (1,539 | ) |
Accumulated deficit |
| (460,788 | ) |
|
| (468,058 | ) |
Total stockholders’ equity |
| 631,207 |
|
|
| 268,163 |
|
Total liabilities and stockholders’ equity | $ | 689,532 |
|
| $ | 719,176 |
|
MATTERPORT, INC.
CONDENSED CONSOLIDATED STATEMENTS OF CASH FLOWS
(In thousands, unaudited)
| Six Months Ended June 30, | ||||||
|
| 2022 |
|
|
| 2021 |
|
CASH FLOWS FROM OPERATING ACTIVITIES |
|
|
| ||||
Net income (loss) | $ | 7,270 |
|
| $ | (9,081 | ) |
Adjustments to reconcile net income (loss) to net cash provided by (used in) operating activities: |
|
|
| ||||
Depreciation and amortization |
| 5,563 |
|
|
| 2,608 |
|
Amortization of debt discount |
| — |
|
|
| 135 |
|
Amortization of investment premiums, net of accretion of discounts |
| 1,829 |
|
|
| — |
|
Stock-based compensation, net of amounts capitalized |
| 87,233 |
|
|
| 1,259 |
|
Change in fair value of warrants liabilities |
| (26,147 | ) |
|
| — |
|
Change in fair value of contingent earn-out liability |
| (136,043 | ) |
|
| — |
|
Deferred income taxes |
| 69 |
|
|
| — |
|
Allowance for doubtful accounts |
| 195 |
|
|
| 151 |
|
Loss on disposal of property, plant, and equipment |
| — |
|
|
| 7 |
|
Other |
| 316 |
|
|
| 43 |
|
Changes in operating assets and liabilities, net of effects of businesses acquired: |
|
|
| ||||
Accounts receivable |
| (3,426 | ) |
|
| (2,918 | ) |
Inventories |
| (881 | ) |
|
| 1,024 |
|
Prepaid expenses and other assets |
| (2,946 | ) |
|
| (1,269 | ) |
Accounts payable |
| 2,367 |
|
|
| 1,466 |
|
Deferred revenue |
| 2,641 |
|
|
| 3,024 |
|
Accrued expenses and other liabilities |
| 3,682 |
|
|
| 920 |
|
Net cash used in operating activities |
| (58,278 | ) |
|
| (2,631 | ) |
CASH FLOWS FROM INVESTING ACTIVITIES: |
|
|
| ||||
Purchases of property and equipment |
| (866 | ) |
|
| (326 | ) |
Capitalized software and development costs |
| (7,086 | ) |
|
| (3,256 | ) |
Purchase of investments |
| (87,997 | ) |
|
| — |
|
Maturities of investments |
| 160,124 |
|
|
| — |
|
Investment in convertible notes |
| — |
|
|
| (1,000 | ) |
Business acquisitions, net of cash acquired |
| (30,020 | ) |
|
| — |
|
Net cash provided by (used in) investing activities |
| 34,155 |
|
|
| (4,582 | ) |
CASH FLOW FROM FINANCING ACTIVITIES: |
|
|
| ||||
Payment of transaction costs related to reverse recapitalization |
| — |
|
|
| (1,204 | ) |
Proceeds from sales of shares through employee equity incentive plans |
| 4,892 |
|
|
| 1,342 |
|
Payments for taxes related to net settlement of equity awards |
| (34,424 | ) |
|
| — |
|
Proceeds from exercise of warrants |
| 27,844 |
|
|
| — |
|
Repayment of debt |
| — |
|
|
| (2,390 | ) |
Other |
| 76 |
|
|
| — |
|
Net cash used in financing activities |
| (1,612 | ) |
|
| (2,252 | ) |
Net change in cash, cash equivalents, and restricted cash |
| (25,735 | ) |
|
| (9,465 | ) |
Effect of exchange rate changes on cash |
| (329 | ) |
|
| (104 | ) |
Cash, cash equivalents, and restricted cash at beginning of year |
| 139,987 |
|
|
| 52,250 |
|
Cash, cash equivalents, and restricted cash at end of period | $ | 113,923 |
|
| $ | 42,681 |
|
MATTERPORT, INC.
RECONCILIATION OF GAAP TO NON-GAAP FINANCIAL MEASURES
(In thousands, except per share amounts)
(unaudited)
|
| Three Months Ended June 30, |
| Six Months Ended June 30, | ||||||||||||
|
|
| 2022 |
|
|
| 2021 |
|
|
| 2022 |
|
|
| 2021 |
|
GAAP net income/(loss) |
| $ | (64,634 | ) |
| $ | (6,209 | ) |
| $ | 7,270 |
|
| $ | (9,081 | ) |
Stock-based compensation expense(1) |
|
| 32,889 |
|
|
| 601 |
|
|
| 88,977 |
|
|
| 1,259 |
|
Acquisition-related costs(2) |
|
| 900 |
|
|
| — |
|
|
| 1,072 |
|
|
| — |
|
Amortization expense of acquired intangible assets |
|
| 265 |
|
|
| — |
|
|
| 525 |
|
|
| — |
|
Change in fair value of warrants liabilities(3) |
|
| (4,714 | ) |
|
| — |
|
|
| (26,147 | ) |
|
| — |
|
Change in fair value of contingent earn-out liability(4) |
|
| — |
|
|
| — |
|
|
| (136,043 | ) |
|
| — |
|
Payroll tax related to contingent earn-out share issuance(5) |
|
| — |
|
|
| — |
|
|
| 1,164 |
|
|
| — |
|
Non-GAAP net loss |
| $ | (35,294 | ) |
| $ | (5,608 | ) |
| $ | (63,182 | ) |
| $ | (7,822 | ) |
|
|
|
|
|
|
|
|
| ||||||||
GAAP net income (loss) per share attributable to common stockholders: |
|
|
|
|
|
|
|
| ||||||||
Basic |
| $ | (0.23 | ) |
| $ | (0.15 | ) |
| $ | 0.03 |
|
| $ | (0.22 | ) |
Diluted |
| $ | (0.23 | ) |
| $ | (0.15 | ) |
| $ | 0.02 |
|
| $ | (0.22 | ) |
Non-GAAP net loss per share attributable to common stockholders, basic and diluted |
| $ | (0.12 | ) |
| $ | (0.03 | ) |
| $ | (0.23 | ) |
| $ | (0.05 | ) |
|
|
|
|
|
|
|
|
| ||||||||
GAAP weighted-average shares used to compute net income (loss) per share, basic |
|
| 283,405 |
|
|
| 41,348 |
|
|
| 279,289 |
|
|
| 40,490 |
|
Weighted-average effect of potentially dilutive securities(6) |
|
| — |
|
|
| — |
|
|
| 34,545 |
|
|
| — |
|
GAAP weighted-average shares used to compute net income (loss) per share, diluted |
|
| 283,405 |
|
|
| 41,348 |
|
|
| 313,834 |
|
|
| 40,490 |
|
Excluded anti-dilutive weighted-average potential shares of common stock in calculating non-GAAP loss per share |
|
| — |
|
|
| — |
|
|
| (34,545 | ) |
|
| — |
|
Adjustment for common stock issued in connection with the merger(7) |
|
| — |
|
|
| 127,499 |
|
|
| — |
|
|
| 127,499 |
|
Non-GAAP weighted-average shares used to compute net loss per share, basic and diluted |
|
| 283,405 |
|
|
| 168,847 |
|
|
| 279,289 |
|
|
| 167,989 |
|
|
|
|
|
|
|
|
|
| ||||||||
(1) Consists primarily of non-cash share-based compensation related to the Company's stock incentive plans and earn-out arrangement.
(2) Consists of acquisition transaction costs.
(3) Consists of the non-cash fair value measurement change for public and private warrants.
(4) Represents the non-cash fair-value measurement change related to our earn-out liability.
(5) Represents the payroll tax related to Earn-out shares issuance and release.
(6) Consists of the potentially dilutive effect of employee equity incentive plan awards.
(7) Consists of non-GAAP adjustment of unweighted average common stock issued and converted from Matterport, Inc.’s (now known as Matterport Operating, LLC) previously issued and outstanding shares of convertible preferred stock and common stock warrants prior to the completion of the merger.
A photo accompanying this announcement is available at https://www.globenewswire.com/NewsRoom/AttachmentNg/feca6b90-2fd3-4ac3-96c2-4a312e082011

