
 Yahoo Finance
 You May Have Been Looking At STORE Capital Corporation (NYSE:STOR) All Wrong

STORE Capital Corporation is a US$6.4b mid-cap, real estate investment trust (REIT) based in Scottsdale, United States. REITs own and operate income-generating property and adhere to a different set of regulations. This impacts how STOR’s business operates and also how we should analyse its stock. In this commentary, I’ll take you through some of the things I look at when assessing STOR.
View our latest analysis for STORE Capital
Funds from Operations (FFO) is a higher quality measure of STOR’s earnings compared to net income. This term is very common in the REIT investing world as it provides a cleaner look at its cash flow from daily operations by excluding impact of one-off activities or non-cash items such as depreciation. For STOR, its FFO of US$309m makes up 69% of its gross profit, which means the majority of its earnings are high-quality and recurring.
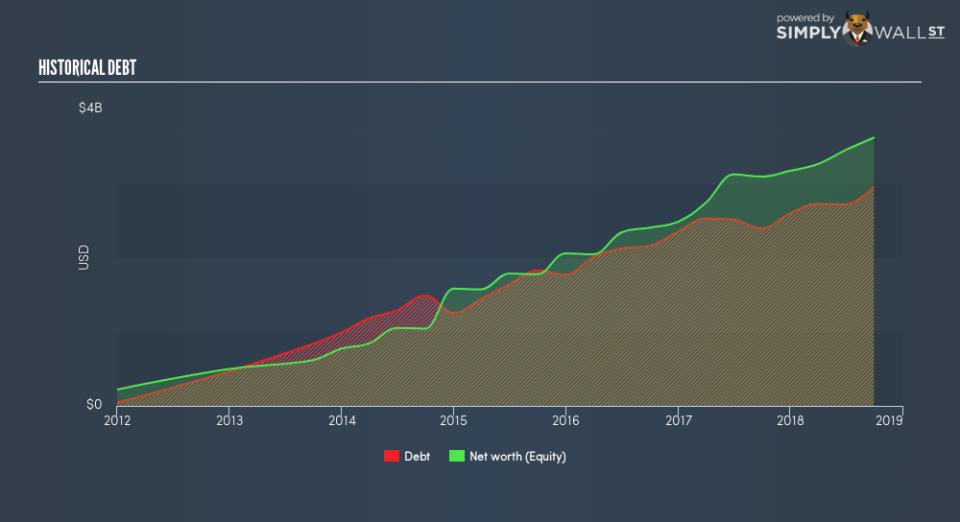
STOR’s financial stability can be gauged by seeing how much its FFO generated each year can cover its total amount of debt. The higher the coverage, the less risky STOR is, broadly speaking, to have debt on its books. The metric I’ll be using, FFO-to-debt, also estimates the time it will take for the company to repay its debt with its FFO. With a ratio of 12%, the credit rating agency Standard & Poor would consider this as aggressive risk. This would take STOR 8.39 years to pay off using just operating income, which is a long time, and risk increases with time. But realistically, companies have many levers to pull in order to pay back their debt, beyond operating income alone.
I also look at STOR’s interest coverage ratio, which demonstrates how many times its earnings can cover its yearly interest expense. This is similar to the concept above, but looks at the upcoming obligations. The ratio is typically calculated using EBIT, but for a REIT stock, it’s better to use FFO divided by net interest. With an interest coverage ratio of 2.57x, STOR is not generating an appropriate amount of cash from its borrowings. Typically, a ratio of greater than 3x is seen as safe.
I also use FFO to look at STOR’s valuation relative to other REITs in United States by using the price-to-FFO metric. This is conceptually the same as the price-to-earnings (PE) ratio, but as previously mentioned, FFO is more suitable. STOR’s price-to-FFO is 20.64x, compared to the long-term industry average of 16.5x, meaning that it is overvalued.
Next Steps:
In this article, I’ve taken a look at Funds from Operations using various metrics, but it is certainly not sufficient to derive an investment decision based on this value alone. STORE Capital can bring about diversification for your portfolio, but before you decide to invest, take a look at the other aspects you must consider before investing:
Future Outlook: What are well-informed industry analysts predicting for STOR’s future growth? Take a look at our free research report of analyst consensus for STOR’s outlook.
Valuation: What is STOR worth today? Is the stock undervalued, even when its growth outlook is factored into its intrinsic value? The intrinsic value infographic in our free research report helps visualize whether STOR is currently mispriced by the market.
Other High-Performing Stocks: Are there other stocks that provide better prospects with proven track records? Explore our free list of these great stocks here.
To help readers see past the short term volatility of the financial market, we aim to bring you a long-term focused research analysis purely driven by fundamental data. Note that our analysis does not factor in the latest price-sensitive company announcements.
The author is an independent contributor and at the time of publication had no position in the stocks mentioned. For errors that warrant correction please contact the editor at editorial-team@simplywallst.com.
