
 Yahoo Finance
 Is Mercury NZ Limited's (NZSE:MCY) 3.2% Dividend Worth Your Time?

Today we'll take a closer look at Mercury NZ Limited (NZSE:MCY) from a dividend investor's perspective. Owning a strong business and reinvesting the dividends is widely seen as an attractive way of growing your wealth. If you are hoping to live on your dividends, it's important to be more stringent with your investments than the average punter. Regular readers know we like to apply the same approach to each dividend stock, and we hope you'll find our analysis useful.
With a goodly-sized dividend yield despite a relatively short payment history, investors might be wondering if Mercury NZ is a new dividend aristocrat in the making. It sure looks interesting on these metrics - but there's always more to the story . When buying stocks for their dividends, you should always run through the checks below, to see if the dividend looks sustainable.
Explore this interactive chart for our latest analysis on Mercury NZ!
Payout ratios
Dividends are typically paid from company earnings. If a company pays more in dividends than it earned, then the dividend might become unsustainable - hardly an ideal situation. As a result, we should always investigate whether a company can afford its dividend, measured as a percentage of a company's net income after tax. Looking at the data, we can see that 59% of Mercury NZ's profits were paid out as dividends in the last 12 months. This is a fairly normal payout ratio among most businesses. It allows a higher dividend to be paid to shareholders, but does limit the capital retained in the business - which could be good or bad.
We also measure dividends paid against a company's levered free cash flow, to see if enough cash was generated to cover the dividend. Mercury NZ paid out 102% of its free cash last year. Cash flows can be lumpy, but this dividend was not well covered by cash flow. Mercury NZ paid out less in dividends than it reported in profits, but unfortunately it didn't generate enough free cash flow to cover the dividend. Were it to repeatedly pay dividends that were not well covered by cash flow, this could be a risk to Mercury NZ's ability to maintain its dividend.
Is Mercury NZ's Balance Sheet Risky?
As Mercury NZ has a meaningful amount of debt, we need to check its balance sheet to see if the company might have debt risks. A quick check of its financial situation can be done with two ratios: net debt divided by EBITDA (earnings before interest, tax, depreciation and amortisation), and net interest cover. Net debt to EBITDA is a measure of a company's total debt. Net interest cover measures the ability to meet interest payments. Essentially we check that a) the company does not have too much debt, and b) that it can afford to pay the interest. With net debt of 2.42 times its EBITDA, Mercury NZ's debt burden is within a normal range for most listed companies.
Net interest cover can be calculated by dividing earnings before interest and tax (EBIT) by the company's net interest expense. With EBIT of 4.01 times its interest expense, Mercury NZ's interest cover is starting to look a bit thin.
We update our data on Mercury NZ every 24 hours, so you can always get our latest analysis of its financial health, here.
Dividend Volatility
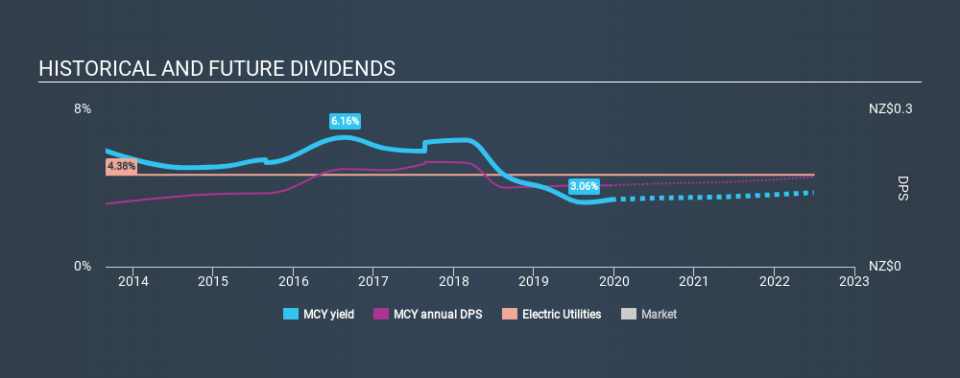
Before buying a stock for its income, we want to see if the dividends have been stable in the past, and if the company has a track record of maintaining its dividend. Looking at the data, we can see that Mercury NZ has been paying a dividend for the past six years. It's good to see that Mercury NZ has been paying a dividend for a number of years. However, the dividend has been cut at least once in the past, and we're concerned that what has been cut once, could be cut again. During the past six-year period, the first annual payment was NZ$0.12 in 2013, compared to NZ$0.15 last year. Dividends per share have grown at approximately 4.4% per year over this time. The growth in dividends has not been linear, but the CAGR is a decent approximation of the rate of change over this time frame.
We're glad to see the dividend has risen, but with a limited rate of growth and fluctuations in the payments, we don't think this is an attractive combination.
Dividend Growth Potential
With a relatively unstable dividend, it's even more important to see if earnings per share (EPS) are growing. Why take the risk of a dividend getting cut, unless there's a good chance of bigger dividends in future? It's good to see Mercury NZ has been growing its earnings per share at 11% a year over the past five years. Mercury NZ's earnings per share have grown rapidly in recent years, although more than half of its profits are being paid out as dividends, which makes us wonder if the company has a limited number of reinvestment opportunities in its business.
Conclusion
Dividend investors should always want to know if a) a company's dividends are affordable, b) if there is a track record of consistent payments, and c) if the dividend is capable of growing. Mercury NZ gets a pass on its dividend payout ratio, but it paid out virtually all of its cash flow as dividends. This may just be a one-off, but we'd keep an eye on this. We were also glad to see it growing earnings, but it was concerning to see the dividend has been cut at least once in the past. In sum, we find it hard to get excited about Mercury NZ from a dividend perspective. It's not that we think it's a bad business; just that there are other companies that perform better on these criteria.
Earnings growth generally bodes well for the future value of company dividend payments. See if the 6 Mercury NZ analysts we track are forecasting continued growth with our free report on analyst estimates for the company.
If you are a dividend investor, you might also want to look at our curated list of dividend stocks yielding above 3%.
If you spot an error that warrants correction, please contact the editor at editorial-team@simplywallst.com. This article by Simply Wall St is general in nature. It does not constitute a recommendation to buy or sell any stock, and does not take account of your objectives, or your financial situation. Simply Wall St has no position in the stocks mentioned.
We aim to bring you long-term focused research analysis driven by fundamental data. Note that our analysis may not factor in the latest price-sensitive company announcements or qualitative material. Thank you for reading.
