
 Yahoo Finance
 Has Mercury NZ Limited's (NZSE:MCY) Impressive Stock Performance Got Anything to Do With Its Fundamentals?
Most readers would already be aware that Mercury NZ's (NZSE:MCY) stock increased significantly by 7.4% over the past month. As most would know, fundamentals are what usually guide market price movements over the long-term, so we decided to look at the company's key financial indicators today to determine if they have any role to play in the recent price movement. Specifically, we decided to study Mercury NZ's ROE in this article.
Return on Equity or ROE is a test of how effectively a company is growing its value and managing investors’ money. Put another way, it reveals the company's success at turning shareholder investments into profits.
See our latest analysis for Mercury NZ
How Do You Calculate Return On Equity?
Return on equity can be calculated by using the formula:
Return on Equity = Net Profit (from continuing operations) ÷ Shareholders' Equity
So, based on the above formula, the ROE for Mercury NZ is:
3.4% = NZ$141m ÷ NZ$4.2b (Based on the trailing twelve months to June 2021).
The 'return' is the income the business earned over the last year. That means that for every NZ$1 worth of shareholders' equity, the company generated NZ$0.03 in profit.
What Has ROE Got To Do With Earnings Growth?
So far, we've learned that ROE is a measure of a company's profitability. We now need to evaluate how much profit the company reinvests or "retains" for future growth which then gives us an idea about the growth potential of the company. Generally speaking, other things being equal, firms with a high return on equity and profit retention, have a higher growth rate than firms that don’t share these attributes.
Mercury NZ's Earnings Growth And 3.4% ROE
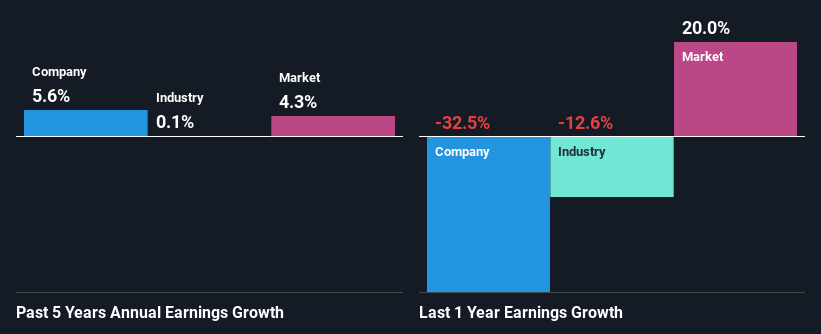
It is quite clear that Mercury NZ's ROE is rather low. Not just that, even compared to the industry average of 5.4%, the company's ROE is entirely unremarkable. However, the moderate 5.6% net income growth seen by Mercury NZ over the past five years is definitely a positive. We reckon that there could be other factors at play here. Such as - high earnings retention or an efficient management in place.
Next, on comparing with the industry net income growth, we found that Mercury NZ's growth is quite high when compared to the industry average growth of 2.2% in the same period, which is great to see.
Earnings growth is an important metric to consider when valuing a stock. The investor should try to establish if the expected growth or decline in earnings, whichever the case may be, is priced in. Doing so will help them establish if the stock's future looks promising or ominous. What is MCY worth today? The intrinsic value infographic in our free research report helps visualize whether MCY is currently mispriced by the market.
Is Mercury NZ Efficiently Re-investing Its Profits?
The high three-year median payout ratio of 89% (or a retention ratio of 11%) for Mercury NZ suggests that the company's growth wasn't really hampered despite it returning most of its income to its shareholders.
Moreover, Mercury NZ is determined to keep sharing its profits with shareholders which we infer from its long history of eight years of paying a dividend. Upon studying the latest analysts' consensus data, we found that the company's future payout ratio is expected to rise to 127% over the next three years. However, Mercury NZ's future ROE is expected to rise to 5.5% despite the expected increase in the company's payout ratio. We infer that there could be other factors that could be driving the anticipated growth in the company's ROE.
Summary
In total, it does look like Mercury NZ has some positive aspects to its business. Namely, its high earnings growth. We do however feel that the earnings growth number could have been even higher, had the company been reinvesting more of its earnings and paid out less dividends. Having said that, looking at the current analyst estimates, we found that the company's earnings are expected to gain momentum. To know more about the latest analysts predictions for the company, check out this visualization of analyst forecasts for the company.
Have feedback on this article? Concerned about the content? Get in touch with us directly. Alternatively, email editorial-team (at) simplywallst.com.
This article by Simply Wall St is general in nature. We provide commentary based on historical data and analyst forecasts only using an unbiased methodology and our articles are not intended to be financial advice. It does not constitute a recommendation to buy or sell any stock, and does not take account of your objectives, or your financial situation. We aim to bring you long-term focused analysis driven by fundamental data. Note that our analysis may not factor in the latest price-sensitive company announcements or qualitative material. Simply Wall St has no position in any stocks mentioned.
