
 Yahoo Finance
 Meta Data Limited's (NYSE:AIU) Share Price Not Quite Adding Up
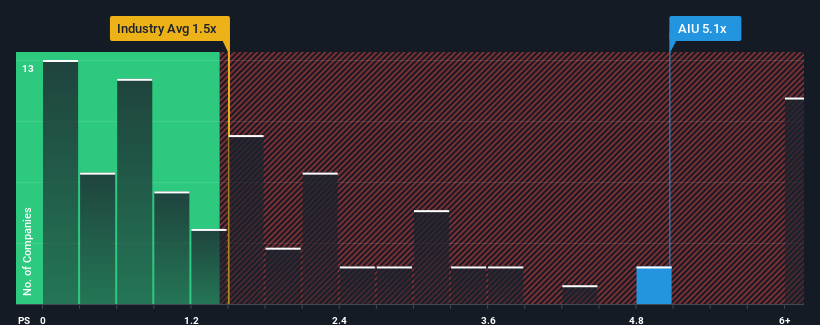
When close to half the companies in the Consumer Services industry in the United States have price-to-sales ratios (or "P/S") below 1.5x, you may consider Meta Data Limited (NYSE:AIU) as a stock to avoid entirely with its 5.1x P/S ratio. Although, it's not wise to just take the P/S at face value as there may be an explanation why it's so lofty.
View our latest analysis for Meta Data
What Does Meta Data's P/S Mean For Shareholders?
For example, consider that Meta Data's financial performance has been poor lately as its revenue has been in decline. It might be that many expect the company to still outplay most other companies over the coming period, which has kept the P/S from collapsing. However, if this isn't the case, investors might get caught out paying too much for the stock.
Although there are no analyst estimates available for Meta Data, take a look at this free data-rich visualisation to see how the company stacks up on earnings, revenue and cash flow.
Is There Enough Revenue Growth Forecasted For Meta Data?
There's an inherent assumption that a company should far outperform the industry for P/S ratios like Meta Data's to be considered reasonable.
Retrospectively, the last year delivered a frustrating 95% decrease to the company's top line. This means it has also seen a slide in revenue over the longer-term as revenue is down 97% in total over the last three years. Accordingly, shareholders would have felt downbeat about the medium-term rates of revenue growth.
Weighing that medium-term revenue trajectory against the broader industry's one-year forecast for expansion of 13% shows it's an unpleasant look.
With this information, we find it concerning that Meta Data is trading at a P/S higher than the industry. It seems most investors are ignoring the recent poor growth rate and are hoping for a turnaround in the company's business prospects. Only the boldest would assume these prices are sustainable as a continuation of recent revenue trends is likely to weigh heavily on the share price eventually.
What We Can Learn From Meta Data's P/S?
Typically, we'd caution against reading too much into price-to-sales ratios when settling on investment decisions, though it can reveal plenty about what other market participants think about the company.
Our examination of Meta Data revealed its shrinking revenue over the medium-term isn't resulting in a P/S as low as we expected, given the industry is set to grow. When we see revenue heading backwards and underperforming the industry forecasts, we feel the possibility of the share price declining is very real, bringing the P/S back into the realm of reasonability. Unless the recent medium-term conditions improve markedly, investors will have a hard time accepting the share price as fair value.
Before you settle on your opinion, we've discovered 4 warning signs for Meta Data (3 make us uncomfortable!) that you should be aware of.
If strong companies turning a profit tickle your fancy, then you'll want to check out this free list of interesting companies that trade on a low P/E (but have proven they can grow earnings).
Have feedback on this article? Concerned about the content? Get in touch with us directly. Alternatively, email editorial-team (at) simplywallst.com.
This article by Simply Wall St is general in nature. We provide commentary based on historical data and analyst forecasts only using an unbiased methodology and our articles are not intended to be financial advice. It does not constitute a recommendation to buy or sell any stock, and does not take account of your objectives, or your financial situation. We aim to bring you long-term focused analysis driven by fundamental data. Note that our analysis may not factor in the latest price-sensitive company announcements or qualitative material. Simply Wall St has no position in any stocks mentioned.
