
 Yahoo Finance
 Can Mixed Fundamentals Have A Negative Impact on Driver Group plc (LON:DRV) Current Share Price Momentum?
Driver Group (LON:DRV) has had a great run on the share market with its stock up by a significant 21% over the last three months. However, we decided to pay attention to the company's fundamentals which don't appear to give a clear sign about the company's financial health. In this article, we decided to focus on Driver Group's ROE.
Return on Equity or ROE is a test of how effectively a company is growing its value and managing investors’ money. Simply put, it is used to assess the profitability of a company in relation to its equity capital.
Check out our latest analysis for Driver Group
How Is ROE Calculated?
ROE can be calculated by using the formula:
Return on Equity = Net Profit (from continuing operations) ÷ Shareholders' Equity
So, based on the above formula, the ROE for Driver Group is:
1.8% = UK£371k ÷ UK£20m (Based on the trailing twelve months to March 2022).
The 'return' is the amount earned after tax over the last twelve months. Another way to think of that is that for every £1 worth of equity, the company was able to earn £0.02 in profit.
What Has ROE Got To Do With Earnings Growth?
Thus far, we have learned that ROE measures how efficiently a company is generating its profits. Based on how much of its profits the company chooses to reinvest or "retain", we are then able to evaluate a company's future ability to generate profits. Assuming everything else remains unchanged, the higher the ROE and profit retention, the higher the growth rate of a company compared to companies that don't necessarily bear these characteristics.
Driver Group's Earnings Growth And 1.8% ROE
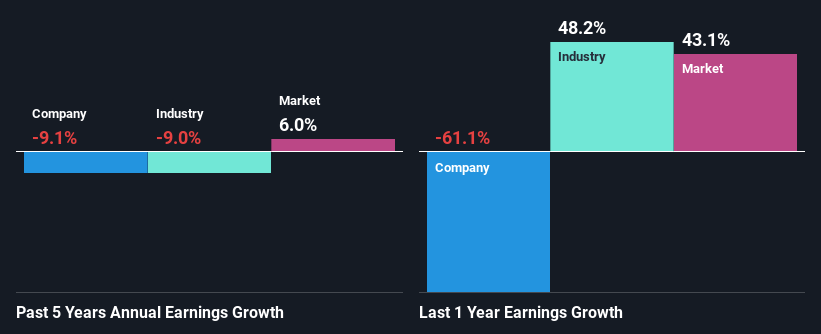
It is quite clear that Driver Group's ROE is rather low. Even when compared to the industry average of 8.1%, the ROE figure is pretty disappointing. Therefore, it might not be wrong to say that the five year net income decline of 9.1% seen by Driver Group was possibly a result of it having a lower ROE. However, there could also be other factors causing the earnings to decline. For example, the business has allocated capital poorly, or that the company has a very high payout ratio.
From the 9.0% decline reported by the industry in the same period, we infer that Driver Group and its industry are both shrinking at a similar rate.
Earnings growth is an important metric to consider when valuing a stock. The investor should try to establish if the expected growth or decline in earnings, whichever the case may be, is priced in. This then helps them determine if the stock is placed for a bright or bleak future. If you're wondering about Driver Group's's valuation, check out this gauge of its price-to-earnings ratio, as compared to its industry.
Is Driver Group Efficiently Re-investing Its Profits?
Despite having a normal three-year median payout ratio of 34% (where it is retaining 66% of its profits), Driver Group has seen a decline in earnings as we saw above. So there might be other factors at play here which could potentially be hampering growth. For example, the business has faced some headwinds.
Moreover, Driver Group has been paying dividends for at least ten years or more suggesting that management must have perceived that the shareholders prefer dividends over earnings growth.
Conclusion
On the whole, we feel that the performance shown by Driver Group can be open to many interpretations. While the company does have a high rate of profit retention, its low rate of return is probably hampering its earnings growth. Having said that, looking at current analyst estimates, we found that the company's earnings growth rate is expected to see a huge improvement. Are these analysts expectations based on the broad expectations for the industry, or on the company's fundamentals? Click here to be taken to our analyst's forecasts page for the company.
Have feedback on this article? Concerned about the content? Get in touch with us directly. Alternatively, email editorial-team (at) simplywallst.com.
This article by Simply Wall St is general in nature. We provide commentary based on historical data and analyst forecasts only using an unbiased methodology and our articles are not intended to be financial advice. It does not constitute a recommendation to buy or sell any stock, and does not take account of your objectives, or your financial situation. We aim to bring you long-term focused analysis driven by fundamental data. Note that our analysis may not factor in the latest price-sensitive company announcements or qualitative material. Simply Wall St has no position in any stocks mentioned.
