
 Yahoo Finance
 How Much Of Property For Industry Limited (NZSE:PFI) Do Institutions Own?

Want to participate in a short research study? Help shape the future of investing tools and you could win a $250 gift card!
A look at the shareholders of Property For Industry Limited (NZSE:PFI) can tell us which group is most powerful. Large companies usually have institutions as shareholders, and we usually see insiders owning shares in smaller companies. Companies that have been privatized tend to have low insider ownership.
With a market capitalization of NZ$1.1b, Property For Industry is a small cap stock, so it might not be well known by many institutional investors. Taking a look at our data on the ownership groups (below), it's seems that institutional investors have bought into the company. We can zoom in on the different ownership groups, to learn more about PFI.
Check out our latest analysis for Property For Industry

What Does The Institutional Ownership Tell Us About Property For Industry?
Many institutions measure their performance against an index that approximates the local market. So they usually pay more attention to companies that are included in major indices.
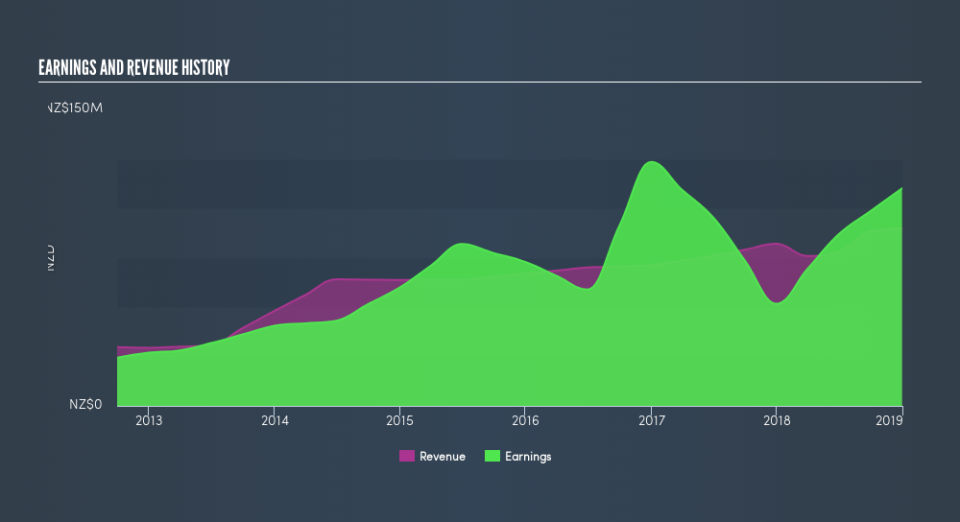
Property For Industry already has institutions on the share registry. Indeed, they own 31% of the company. This implies the analysts working for those institutions have looked at the stock and they like it. But just like anyone else, they could be wrong. If multiple institutions change their view on a stock at the same time, you could see the share price drop fast. It's therefore worth looking at Property For Industry's earnings history, below. Of course, the future is what really matters.
Property For Industry is not owned by hedge funds. Quite a few analysts cover the stock, so you could look into forecast growth quite easily.
Insider Ownership Of Property For Industry
The definition of company insiders can be subjective, and does vary between jurisdictions. Our data reflects individual insiders, capturing board members at the very least. The company management answer to the board; and the latter should represent the interests of shareholders. Notably, sometimes top-level managers are on the board, themselves.
I generally consider insider ownership to be a good thing. However, on some occasions it makes it more difficult for other shareholders to hold the board accountable for decisions.
Shareholders would probably be interested to learn that insiders own shares in Property For Industry Limited. In their own names, insiders own NZ$34m worth of stock in the NZ$1.1b company. This shows at least some alignment. You can click here to see if those insiders have been buying or selling.
General Public Ownership
The general public, mostly retail investors, hold a substantial 65% stake in PFI, suggesting it is a fairly popular stock. This level of ownership gives retail investors the power to sway key policy decisions such as board composition, executive compensation, and the dividend payout ratio.
Next Steps:
I find it very interesting to look at who exactly owns a company. But to truly gain insight, we need to consider other information, too.
I like to dive deeper into how a company has performed in the past. You can access this interactive graph of past earnings, revenue and cash flow, for free .
If you are like me, you may want to think about whether this company will grow or shrink. Luckily, you can check this free report showing analyst forecasts for its future.
NB: Figures in this article are calculated using data from the last twelve months, which refer to the 12-month period ending on the last date of the month the financial statement is dated. This may not be consistent with full year annual report figures.
We aim to bring you long-term focused research analysis driven by fundamental data. Note that our analysis may not factor in the latest price-sensitive company announcements or qualitative material.
If you spot an error that warrants correction, please contact the editor at editorial-team@simplywallst.com. This article by Simply Wall St is general in nature. It does not constitute a recommendation to buy or sell any stock, and does not take account of your objectives, or your financial situation. Simply Wall St has no position in the stocks mentioned. Thank you for reading.
