
 Yahoo Finance
 What You Must Know About Serko Limited’s (NZSE:SKO) Financial Strength

While small-cap stocks, such as Serko Limited (NZSE:SKO) with its market cap of NZ$224.68m, are popular for their explosive growth, investors should also be aware of their balance sheet to judge whether the company can survive a downturn. Companies operating in the Internet industry, even ones that are profitable, are more likely to be higher risk. So, understanding the company’s financial health becomes vital. I believe these basic checks tell most of the story you need to know. However, given that I have not delve into the company-specifics, I recommend you dig deeper yourself into SKO here.
Does SKO produce enough cash relative to debt?
SKO has shrunken its total debt levels in the last twelve months, from NZ$653.00k to NZ$555.00k , which is made up of current and long term debt. With this debt repayment, the current cash and short-term investment levels stands at NZ$5.23m , ready to deploy into the business. Moreover, SKO has produced cash from operations of NZ$1.42m during the same period of time, leading to an operating cash to total debt ratio of 255.14%, signalling that SKO’s current level of operating cash is high enough to cover debt. This ratio can also be interpreted as a measure of efficiency as an alternative to return on assets. In SKO’s case, it is able to generate 2.55x cash from its debt capital.
Can SKO meet its short-term obligations with the cash in hand?
Looking at SKO’s most recent NZ$3.24m liabilities, the company has maintained a safe level of current assets to meet its obligations, with the current ratio last standing at 2.88x. Generally, for Internet companies, this is a reasonable ratio as there’s enough of a cash buffer without holding too capital in low return investments.
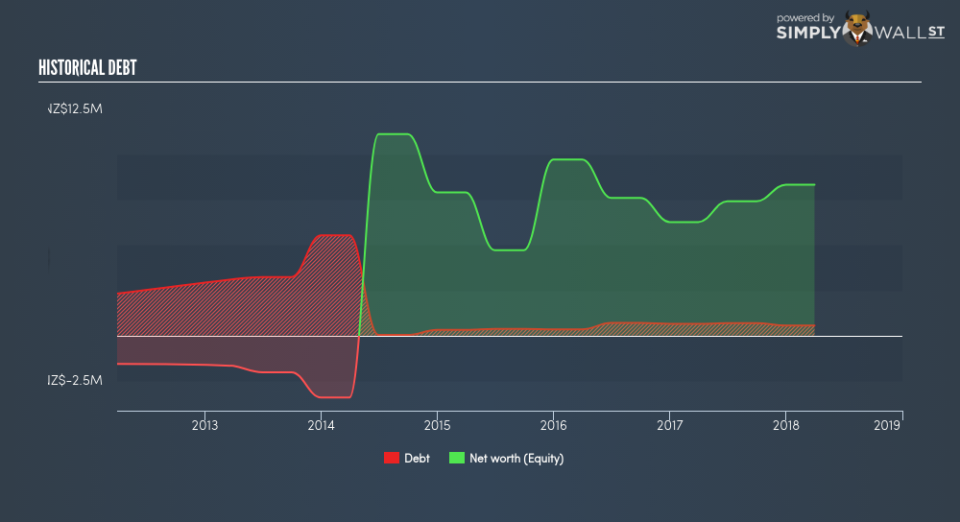
Is SKO’s debt level acceptable?
With debt at 6.65% of equity, SKO may be thought of as having low leverage. This range is considered safe as SKO is not taking on too much debt obligation, which can be restrictive and risky for equity-holders.
Next Steps:
SKO’s high cash coverage and low debt levels indicate its ability to utilise its borrowings efficiently in order to generate ample cash flow. Furthermore, the company exhibits an ability to meet its near term obligations should an adverse event occur. I admit this is a fairly basic analysis for SKO’s financial health. Other important fundamentals need to be considered alongside. I suggest you continue to research Serko to get a more holistic view of the stock by looking at:
Valuation: What is SKO worth today? Is the stock undervalued, even when its growth outlook is factored into its intrinsic value? The intrinsic value infographic in our free research report helps visualize whether SKO is currently mispriced by the market.
Historical Performance: What has SKO’s returns been like over the past? Go into more detail in the past track record analysis and take a look at the free visual representations of our analysis for more clarity.
Other High-Performing Stocks: Are there other stocks that provide better prospects with proven track records? Explore our free list of these great stocks here.
To help readers see pass the short term volatility of the financial market, we aim to bring you a long-term focused research analysis purely driven by fundamental data. Note that our analysis does not factor in the latest price sensitive company announcements.
The author is an independent contributor and at the time of publication had no position in the stocks mentioned.
