
 Yahoo Finance
 What You Must Know About STMicroelectronics NV’s (EPA:STM) Financial Strength

There are a number of reasons that attract investors towards large-cap companies such as STMicroelectronics NV (EPA:STM), with a market cap of €20.14b. Risk-averse investors who are attracted to diversified streams of revenue and strong capital returns tend to seek out these large companies. However, the health of the financials determines whether the company continues to succeed. I will provide an overview of STMicroelectronics’s financial liquidity and leverage to give you an idea of STMicroelectronics’s position to take advantage of potential acquisitions or comfortably endure future downturns. Note that this information is centred entirely on financial health and is a high-level overview, so I encourage you to look further into STM here. Check out our latest analysis for STMicroelectronics
How much cash does STM generate through its operations?
STM has built up its total debt levels in the last twelve months, from €1.45b to €0 , which comprises of short- and long-term debt. With this increase in debt, STM currently has €2.19b remaining in cash and short-term investments for investing into the business. On top of this, STM has generated cash from operations of €1.97b during the same period of time, leading to an operating cash to total debt ratio of 116.34%, signalling that STM’s debt is appropriately covered by operating cash. This ratio can also be a sign of operational efficiency as an alternative to return on assets. In STM’s case, it is able to generate 1.16x cash from its debt capital.
Can STM meet its short-term obligations with the cash in hand?
With current liabilities at €2.03b, it appears that the company has been able to meet these commitments with a current assets level of €5.10b, leading to a 2.51x current account ratio. Usually, for Semiconductor companies, this is a suitable ratio since there’s sufficient cash cushion without leaving too much capital idle or in low-earning investments.
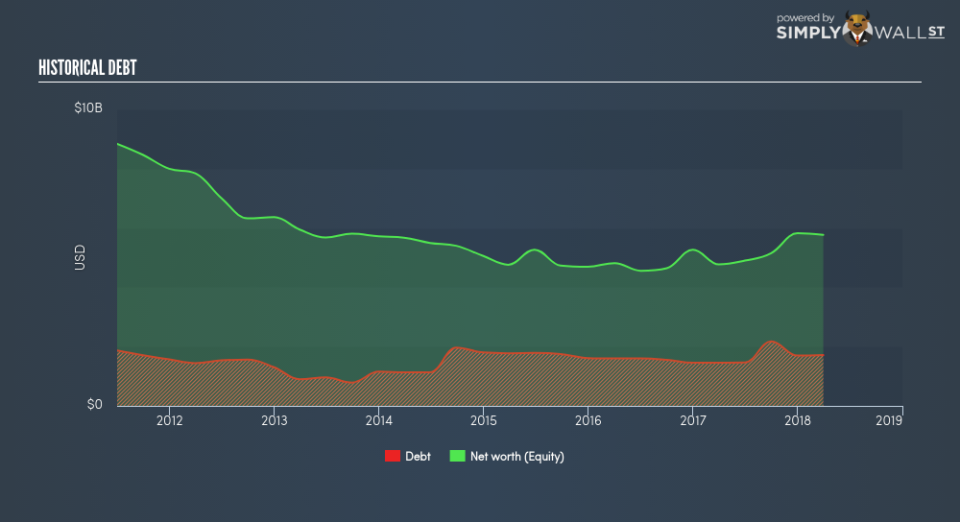
Is STM’s debt level acceptable?
With a debt-to-equity ratio of 29.68%, STM’s debt level may be seen as prudent. This range is considered safe as STM is not taking on too much debt obligation, which can be restrictive and risky for equity-holders. We can test if STM’s debt levels are sustainable by measuring interest payments against earnings of a company. As a rule of thumb, a company should have earnings before interest and tax (EBIT) of at least three times the size of net interest. In STM’s case, the ratio of 25.89x suggests that interest is comfortably covered. Large-cap investments like STM are often believed to be a safe investment due to their ability to pump out ample earnings multiple times its interest payments.
Next Steps:
STM’s high cash coverage and appropriate debt levels indicate its ability to utilise its borrowings efficiently in order to generate ample cash flow. In addition to this, the company exhibits proper management of current assets and upcoming liabilities. This is only a rough assessment of financial health, and I’m sure STM has company-specific issues impacting its capital structure decisions. I suggest you continue to research STMicroelectronics to get a more holistic view of the stock by looking at:
Future Outlook: What are well-informed industry analysts predicting for STM’s future growth? Take a look at our free research report of analyst consensus for STM’s outlook.
Valuation: What is STM worth today? Is the stock undervalued, even when its growth outlook is factored into its intrinsic value? The intrinsic value infographic in our free research report helps visualize whether STM is currently mispriced by the market.
Other High-Performing Stocks: Are there other stocks that provide better prospects with proven track records? Explore our free list of these great stocks here.
To help readers see pass the short term volatility of the financial market, we aim to bring you a long-term focused research analysis purely driven by fundamental data. Note that our analysis does not factor in the latest price sensitive company announcements.
The author is an independent contributor and at the time of publication had no position in the stocks mentioned.
