
 Yahoo Finance
 What You Must Know About Wipro Limited’s (NSE:WIPRO) Financial Health

Wipro Limited (NSE:WIPRO), a large-cap worth ₹1.51t, comes to mind for investors seeking a strong and reliable stock investment. Most investors favour these big stocks due to their strong balance sheet and high market liquidity, meaning there are an adundance of stock in the public market available for trading. In times of low liquidity in the market, these firms won’t be left high and dry. They are also relatively unaffected by increases in interest rates. Using the most recent data for WIPRO, I will determine its financial status based on its solvency and liquidity, and assess whether the stock is a safe investment.
See our latest analysis for Wipro
How does WIPRO’s operating cash flow stack up against its debt?
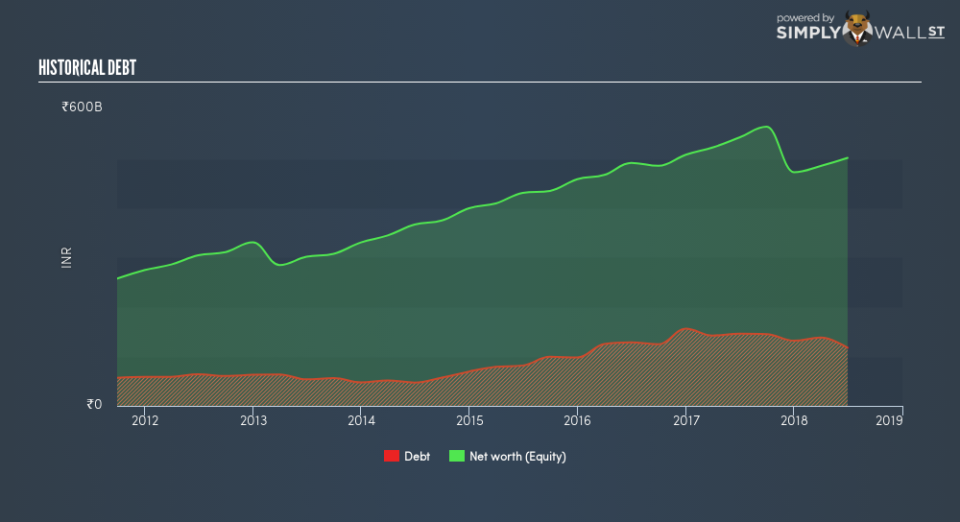
Over the past year, WIPRO has reduced its debt from ₹146.20b to ₹117.73b , which comprises of short- and long-term debt. With this reduction in debt, WIPRO currently has ₹324.07b remaining in cash and short-term investments , ready to deploy into the business. Additionally, WIPRO has produced ₹83.49b in operating cash flow over the same time period, leading to an operating cash to total debt ratio of 70.9%, indicating that WIPRO’s debt is appropriately covered by operating cash. This ratio can also be a sign of operational efficiency as an alternative to return on assets. In WIPRO’s case, it is able to generate 0.71x cash from its debt capital.
Can WIPRO meet its short-term obligations with the cash in hand?
At the current liabilities level of ₹198.94b liabilities, the company has been able to meet these obligations given the level of current assets of ₹503.99b, with a current ratio of 2.53x. Generally, for IT companies, this is a reasonable ratio since there is a bit of a cash buffer without leaving too much capital in a low-return environment.
Is WIPRO’s debt level acceptable?
With debt at 23.5% of equity, WIPRO may be thought of as appropriately levered. This range is considered safe as WIPRO is not taking on too much debt obligation, which may be constraining for future growth.
Next Steps:
WIPRO’s high cash coverage and appropriate debt levels indicate its ability to utilise its borrowings efficiently in order to generate ample cash flow. In addition to this, the company exhibits proper management of current assets and upcoming liabilities. This is only a rough assessment of financial health, and I’m sure WIPRO has company-specific issues impacting its capital structure decisions. I suggest you continue to research Wipro to get a more holistic view of the stock by looking at:
Future Outlook: What are well-informed industry analysts predicting for WIPRO’s future growth? Take a look at our free research report of analyst consensus for WIPRO’s outlook.
Valuation: What is WIPRO worth today? Is the stock undervalued, even when its growth outlook is factored into its intrinsic value? The intrinsic value infographic in our free research report helps visualize whether WIPRO is currently mispriced by the market.
Other High-Performing Stocks: Are there other stocks that provide better prospects with proven track records? Explore our free list of these great stocks here.
To help readers see past the short term volatility of the financial market, we aim to bring you a long-term focused research analysis purely driven by fundamental data. Note that our analysis does not factor in the latest price-sensitive company announcements.
The author is an independent contributor and at the time of publication had no position in the stocks mentioned. For errors that warrant correction please contact the editor at editorial-team@simplywallst.com.
