
 Yahoo Finance
 Newegg Commerce (NASDAQ:NEGG) Shareholders Will Want The ROCE Trajectory To Continue
Did you know there are some financial metrics that can provide clues of a potential multi-bagger? Typically, we'll want to notice a trend of growing return on capital employed (ROCE) and alongside that, an expanding base of capital employed. Ultimately, this demonstrates that it's a business that is reinvesting profits at increasing rates of return. Speaking of which, we noticed some great changes in Newegg Commerce's (NASDAQ:NEGG) returns on capital, so let's have a look.
Understanding Return On Capital Employed (ROCE)
For those who don't know, ROCE is a measure of a company's yearly pre-tax profit (its return), relative to the capital employed in the business. To calculate this metric for Newegg Commerce, this is the formula:
Return on Capital Employed = Earnings Before Interest and Tax (EBIT) ÷ (Total Assets - Current Liabilities)
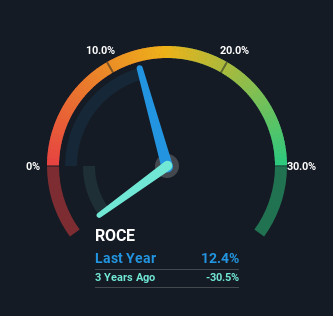
0.12 = US$34m ÷ (US$627m - US$356m) (Based on the trailing twelve months to December 2021).
Thus, Newegg Commerce has an ROCE of 12%. By itself that's a normal return on capital and it's in line with the industry's average returns of 12%.
View our latest analysis for Newegg Commerce
While the past is not representative of the future, it can be helpful to know how a company has performed historically, which is why we have this chart above. If you're interested in investigating Newegg Commerce's past further, check out this free graph of past earnings, revenue and cash flow.
What Can We Tell From Newegg Commerce's ROCE Trend?
We're delighted to see that Newegg Commerce is reaping rewards from its investments and is now generating some pre-tax profits. About three years ago the company was generating losses but things have turned around because it's now earning 12% on its capital. In addition to that, Newegg Commerce is employing 91% more capital than previously which is expected of a company that's trying to break into profitability. This can tell us that the company has plenty of reinvestment opportunities that are able to generate higher returns.
In another part of our analysis, we noticed that the company's ratio of current liabilities to total assets decreased to 57%, which broadly means the business is relying less on its suppliers or short-term creditors to fund its operations. Therefore we can rest assured that the growth in ROCE is a result of the business' fundamental improvements, rather than a cooking class featuring this company's books. Nevertheless, there are some potential risks the company is bearing with current liabilities that high, so just keep that in mind.
What We Can Learn From Newegg Commerce's ROCE
Overall, Newegg Commerce gets a big tick from us thanks in most part to the fact that it is now profitable and is reinvesting in its business. And since the stock has fallen 56% over the last year, there might be an opportunity here. So researching this company further and determining whether or not these trends will continue seems justified.
If you'd like to know about the risks facing Newegg Commerce, we've discovered 1 warning sign that you should be aware of.
If you want to search for solid companies with great earnings, check out this free list of companies with good balance sheets and impressive returns on equity.
Have feedback on this article? Concerned about the content? Get in touch with us directly. Alternatively, email editorial-team (at) simplywallst.com.
This article by Simply Wall St is general in nature. We provide commentary based on historical data and analyst forecasts only using an unbiased methodology and our articles are not intended to be financial advice. It does not constitute a recommendation to buy or sell any stock, and does not take account of your objectives, or your financial situation. We aim to bring you long-term focused analysis driven by fundamental data. Note that our analysis may not factor in the latest price-sensitive company announcements or qualitative material. Simply Wall St has no position in any stocks mentioned.
