
 Yahoo Finance
 NZ Windfarms Limited's (NZSE:NWF) Stock is Soaring But Financials Seem Inconsistent: Will The Uptrend Continue?
NZ Windfarms (NZSE:NWF) has had a great run on the share market with its stock up by a significant 37% over the last three months. However, we wonder if the company's inconsistent financials would have any adverse impact on the current share price momentum. Specifically, we decided to study NZ Windfarms' ROE in this article.
Return on Equity or ROE is a test of how effectively a company is growing its value and managing investors’ money. In simpler terms, it measures the profitability of a company in relation to shareholder's equity.
Check out our latest analysis for NZ Windfarms
How Do You Calculate Return On Equity?
ROE can be calculated by using the formula:
Return on Equity = Net Profit (from continuing operations) ÷ Shareholders' Equity
So, based on the above formula, the ROE for NZ Windfarms is:
3.8% = NZ$1.5m ÷ NZ$38m (Based on the trailing twelve months to December 2020).
The 'return' is the amount earned after tax over the last twelve months. One way to conceptualize this is that for each NZ$1 of shareholders' capital it has, the company made NZ$0.04 in profit.
What Has ROE Got To Do With Earnings Growth?
We have already established that ROE serves as an efficient profit-generating gauge for a company's future earnings. Depending on how much of these profits the company reinvests or "retains", and how effectively it does so, we are then able to assess a company’s earnings growth potential. Assuming all else is equal, companies that have both a higher return on equity and higher profit retention are usually the ones that have a higher growth rate when compared to companies that don't have the same features.
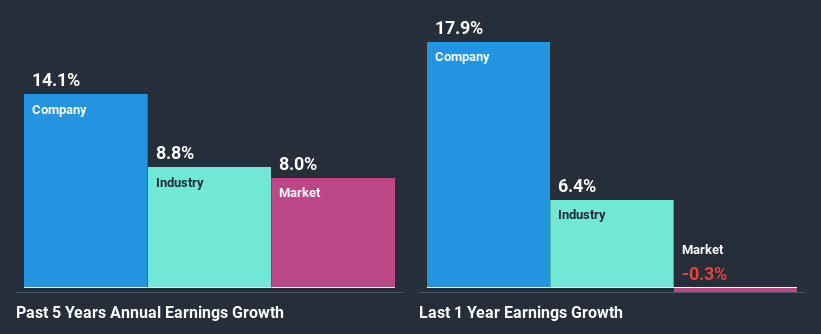
A Side By Side comparison of NZ Windfarms' Earnings Growth And 3.8% ROE
It is hard to argue that NZ Windfarms' ROE is much good in and of itself. Even when compared to the industry average of 8.8%, the ROE figure is pretty disappointing. Although, we can see that NZ Windfarms saw a modest net income growth of 14% over the past five years. Therefore, the growth in earnings could probably have been caused by other variables. For instance, the company has a low payout ratio or is being managed efficiently.
We then compared NZ Windfarms' net income growth with the industry and we're pleased to see that the company's growth figure is higher when compared with the industry which has a growth rate of 8.8% in the same period.
Earnings growth is an important metric to consider when valuing a stock. What investors need to determine next is if the expected earnings growth, or the lack of it, is already built into the share price. This then helps them determine if the stock is placed for a bright or bleak future. One good indicator of expected earnings growth is the P/E ratio which determines the price the market is willing to pay for a stock based on its earnings prospects. So, you may want to check if NZ Windfarms is trading on a high P/E or a low P/E, relative to its industry.
Is NZ Windfarms Efficiently Re-investing Its Profits?
NZ Windfarms' high three-year median payout ratio of 261% suggests that the company is paying out more to its shareholders than what it is making. In spite of this, the company was able to grow its earnings respectably, as we saw above. That being said, the high payout ratio could be worth keeping an eye on in case the company is unable to keep up its current growth momentum. You can see the 3 risks we have identified for NZ Windfarms by visiting our risks dashboard for free on our platform here.
Additionally, NZ Windfarms has paid dividends over a period of three years which means that the company is pretty serious about sharing its profits with shareholders.
Summary
On the whole, we feel that the performance shown by NZ Windfarms can be open to many interpretations. Although the company has shown a pretty impressive growth in earnings, yet the low ROE and the low rate of reinvestment makes us skeptical about the continuity of that growth, especially when or if the business comes to face any threats. So far, we've only made a quick discussion around the company's earnings growth. So it may be worth checking this free detailed graph of NZ Windfarms' past earnings, as well as revenue and cash flows to get a deeper insight into the company's performance.
This article by Simply Wall St is general in nature. It does not constitute a recommendation to buy or sell any stock, and does not take account of your objectives, or your financial situation. We aim to bring you long-term focused analysis driven by fundamental data. Note that our analysis may not factor in the latest price-sensitive company announcements or qualitative material. Simply Wall St has no position in any stocks mentioned.
Have feedback on this article? Concerned about the content? Get in touch with us directly. Alternatively, email editorial-team (at) simplywallst.com.
